

Blog
How to Understand All That Data – Visualize It!
09.09.2019
From Information to Data
There is a bunch of information around us. Wherever you look, information is traveling to you. What can we do with all that information? Use it!
Even Napoleon Bonaparte, one of the greatest military leaders, knew the power of information. He allegedly said that war is ninety percent information. And what did he do with all the information he gathered? He drew it out and prepared his people for battles accordingly. Once he drew the pieces of information, it became data.
Just like Napoleon, we gather information and save it in a form that can be analyzed and prepare for our own battles based on the data.
Old-School Data Analysis
Over the last couple of years, the amount of data has rapidly been increasing, causing headaches to old-school data analysts. They became data experts by manually analyzing data. Such data analysts became one with the data by looking at it on daily basis. They often became friendly with the data through Excel spreadsheets, which used to be good enough when the amount of data was countable in scrollable units. This means that the analyst could scroll from the top to the bottom of the spreadsheet in a satisfying amount of time and could even apply some data rules simply by looking at the columns and rows of the spreadsheet.
SQL – Satisfying, but Not Complete
Once the data stopped being scrollable and could not be exported to an Excel spreadsheet anymore, data analysts started using different approaches like analyzing data by writing SQL queries. At this point, the amount of data which had to be processed could not be kept in data analysts’ minds anymore. SQL queries simplified the data and showed only the part of the data which the data analyst could manage. The main problem with this approach is that data analysts are handling only a part of the data at a given time instead of all of it.
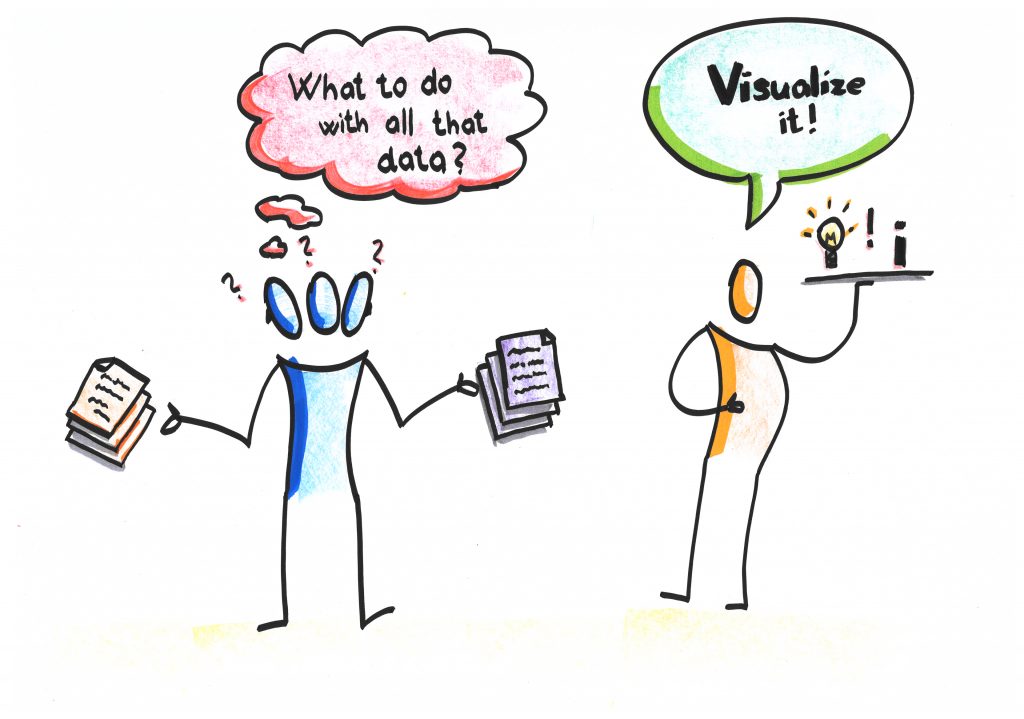
All That Data – How to Manage It?
Currently, we have a huge amount of data. Sometimes it seems like we have data of data. But why do we gather all that data and store it if we do not use it? Even if we want use it, how can we do that? The answer is simple: Draw it! Or in data language: Visualize it!
Complete and Simultaneously Faster!?
By using data visualization, we could see much more, and often discover something that we have never expected to see. Not only that, we could draw conclusions in a mere second by simply taking a glance at the visualized data! Isn’t this just what we need in today’s fast living pace? To do everything as fast as possible?
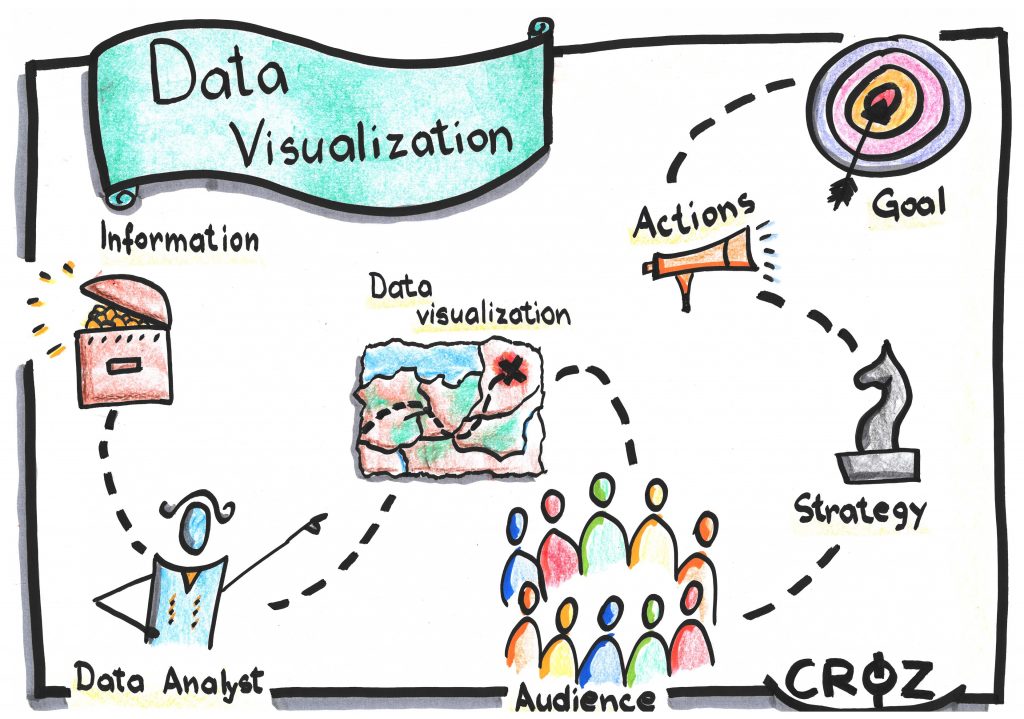
Data Visualization!
What data visualization provides us with:
- A complete picture of our data
- Fast conclusions
By using data visualization, we do not have to make any compromises like analyzing just part of the data or spending days or even weeks before drawing a conclusion from the data. By using data visualization, we can depict all the data we possess – and we have gathered a lot of data over the years – and, sometimes more importantly, we can reach conclusions in a second and lead our battles like true professionals.
For ‘How to Visualize Data’, stay tuned…
You can also apply for our ‘Data Visualization’ course, where you can learn the methodology and how to visualize data quickly and hands-on with PowerBI tool.