AIOps – A bit of distant CROZ history…
Twenty years ago, as a young engineer straight out of the university, I entered the “real” IT world – precisely the field of monitoring enterprise systems. It was the Windows 2000 era; XP was an innovation, and GNU/Linux still didn’t play a significant role at the time. We worked with AIX, SCO Unix, Solaris and of course, IBM mainframe. Right around that time, AS/400 became iSeries and started to work on Power processors. And we needed to monitor all of that.
Here is the cookbook on what we had to do 20 years ago (more or less, it’s still applicable today):
- Collect enough data on IT system workflow (metrics such as CPU load, disks, network subsystem, or application response time)
- Show all that data on a common interface
- Set alert thresholds – for example, turn on the red icon if the CPU load exceeds 90% for five intervals
- Try to correlate collected data, determine interdependence, and detect the real root of outages
- If it’s possible, do the automatization to prevent outages or to recover the system (where it make sense)
- Create a business view for management that shows a simplified overview of how IT services work
Earlier, monitoring systems couldn’t collect enough data, which was the biggest challenge. Over time, monitoring tools and systems significantly improved in terms of generating and collecting relevant data for monitoring. Today, in turn, we collect enormous amounts of data, and this might become a problem.
Nowadays, in the world of microservices, asynchronous communication, cloud components and several layers of virtualization, the challenge is how to determine the problem that will happen and what its root cause is.
Our experience with monitoring systems showed that in today’s complex IT world, it’s necessary to put in more effort (or engineer days) to keep the monitoring system working – including detecting potential problems by tracking data, adjusting thresholds and alerts, and following trends – all with the goal of detecting system anomalies.
Are engineers really that lazy?
It’s well known that system engineers are “lazy” – they like to have something to do repetitive tasks instead of them. The question is – what that “something” is for our monitoring systems?
One of the right answers to this question is – using artificial intelligence or, more precisely, machine learning.
Machine learning ensures high-quality anomaly detection based on learning data set. Detecting anomalies can improve the monitoring system and reduce the work on configuration and maintenance of the system. Sounds great for a lazy engineer!
And that’s how we at CROZ decided to step into the AIOps world. Of course, AIOps covers a much broader range than only monitoring systems, but it was our natural path to use machine learning, particularly for monitoring purposes – and here’s why:
- The data from monitoring systems are clear and well documented
- The data from monitoring systems (usually) don’t contain personal information
- Modern monitoring systems collect lots of usable data
- We have years of experience with both monitoring systems and handling large amounts of data
It’s necessary to add new functionalities to the existing monitoring system for machine learning to help us. These functionalities will enable:
- Development and training of ML model
- Ingesting data from the monitoring system
- Data processing using ML model and anomaly detection
- Data visualization and display in system’s GUI
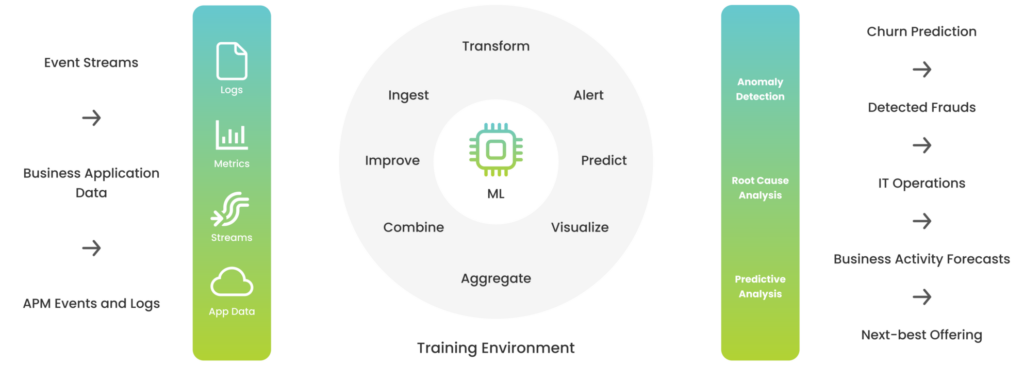
We decided to build a solution applicable not only to monitoring systems but other uses as well. After testing various approaches and components, we started to form outlines of the CROZ AIOps platform with functionalities shown in the picture below.

There are two fundamental environments in this story:
- A training environment
- An execution environment
An ML model is developed and trained based on collected historical data in the training environment for more efficient anomaly detection. When the ML model finishes with the training phase, it’s ready for the execution environment.
Storage and processing of essential data and data retrieval from the monitoring system are done in the execution environment. Based on that data, the ML model analyzes current execution data and calculates the anomaly score.
The data on anomaly score goes back to the monitoring system, updating the existing information and pointing out the anomalies in the monitored system. Note that anomalies can be, for example, not only an unusually high load but also an unusually low load on the component of an IT system.
The advantages of this approach are:
- Early detection of anomalies (which otherwise maybe wouldn’t be detected)
- Reduction of the human work in analyzing events and setting monitoring system thresholds
Apart from anomaly detection, the use of machine learning in monitoring systems includes both Root Cause analysis and predictive analysis, which helps to quickly detect the cause of failures or prevent failures from occurring.
The most important steps to make this story happen were:
- Find a real problem and try to solve it with machine learning methods
- Build a multidiscipline team with AI and data experts, system engineers, and software developers
- Find and integrate the right open-source tools for solving the problem
- Have the right (and powerful) hardware platform, especially in the training phase
- Have a quality set of data
- Visualize data and make a good presentation and demonstration for the management
Asking yourself which software solutions we used, which complications we had on the road and how we solved them? Stay tuned for all of that and more on AIOps at CROZ in the upcoming blogs!
Photo by Tara Winstead from Pexels.
Falls Sie Fragen haben, sind wir nur einen Klick entfernt.


