As an open-source web application with an intuitive interface and advanced capabilities, it has attracted attention and earned recognition from major corporations such as Airbnb, American Express, Netflix, Dropbox, and many others. Perceived as one of the fastest-growing data analytics tools of 2023, Superset today stands as an essential tool for those seeking a deeper understanding and optimization of their data.
‘Following Superset’s Journey’
We first took notice of Superset back in 2020 when we decided to explore what open-source tools had to offer and how useful they could be, among others competing for a position in the data market. Truth be told, Superset did not exactly sweep us off our feet at first glance. Compared to other data visualization and analysis tools, we dare say it had plenty of room for improvement. One example of its shortcomings was the rather limited options for editing visualizations. However, considering it was an open-source tool, what it provided was at a satisfactory level, prompting us to continue following its progress. Our renewed exploration of Superset was sparked by the announcement of the 3.1.0 release, which, according to the release notes, seemed to be a remarkable upgrade to the entire tool.
Which features did we examine? Which of these features impressed us? Do we consider it to be a desirable visualization tool? If you are interested in finding out the answers to these questions, dig into the next two chapters to discover how Superset has enhanced our data journey.
Visualizing Data: The Feature Palette
In Superset, reports and dashboards are not distinguished, they are unified under the umbrella term ‘dashboard’. Visualizations can be easily added to the dashboard through simple drag and drop. One advantage is that within a single dashboard, visualizations based on different schemas can be arranged. Pixel-level customization of the dashboard is enabled through the CSS editor, allowing users to tailor the dashboard’s appearance to their needs and preferences using CSS code.
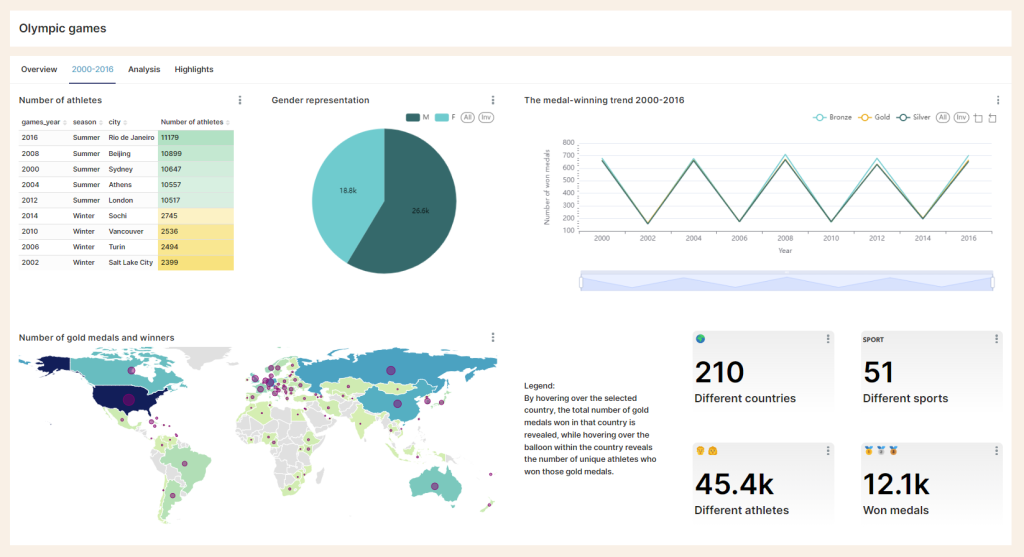
If you look at our example dashboard (Picture 1), with CSS code, we have added a beige background, highlighted numerical graphs in grey and emphasized tab names in bold font. The truth is that even minor adjustments have a significant impact on the final product.

On the other hand, editing options for individual visualizations, not necessarily associated with a specific dashboard, are limited. One specific limitation is the inability to add a legend in the World Map chart. However, compared to our initial exploration of Superset in 2020, Superset has made significant progress in this area. For example, each visualization can now be assigned a colour palette, metrics (e.g., minimum value) can be selected for sorting the x-axis in graphs and conditional formatting is available for numerical visualizations. Additionally, a feature we particularly liked is the ability to add a data zoom slider below time graphs. This allows users to easily adjust the period displayed on the graph. You can see a data zoom slider below “The medal–winning trend 2000–2016” chart (Picture 1).
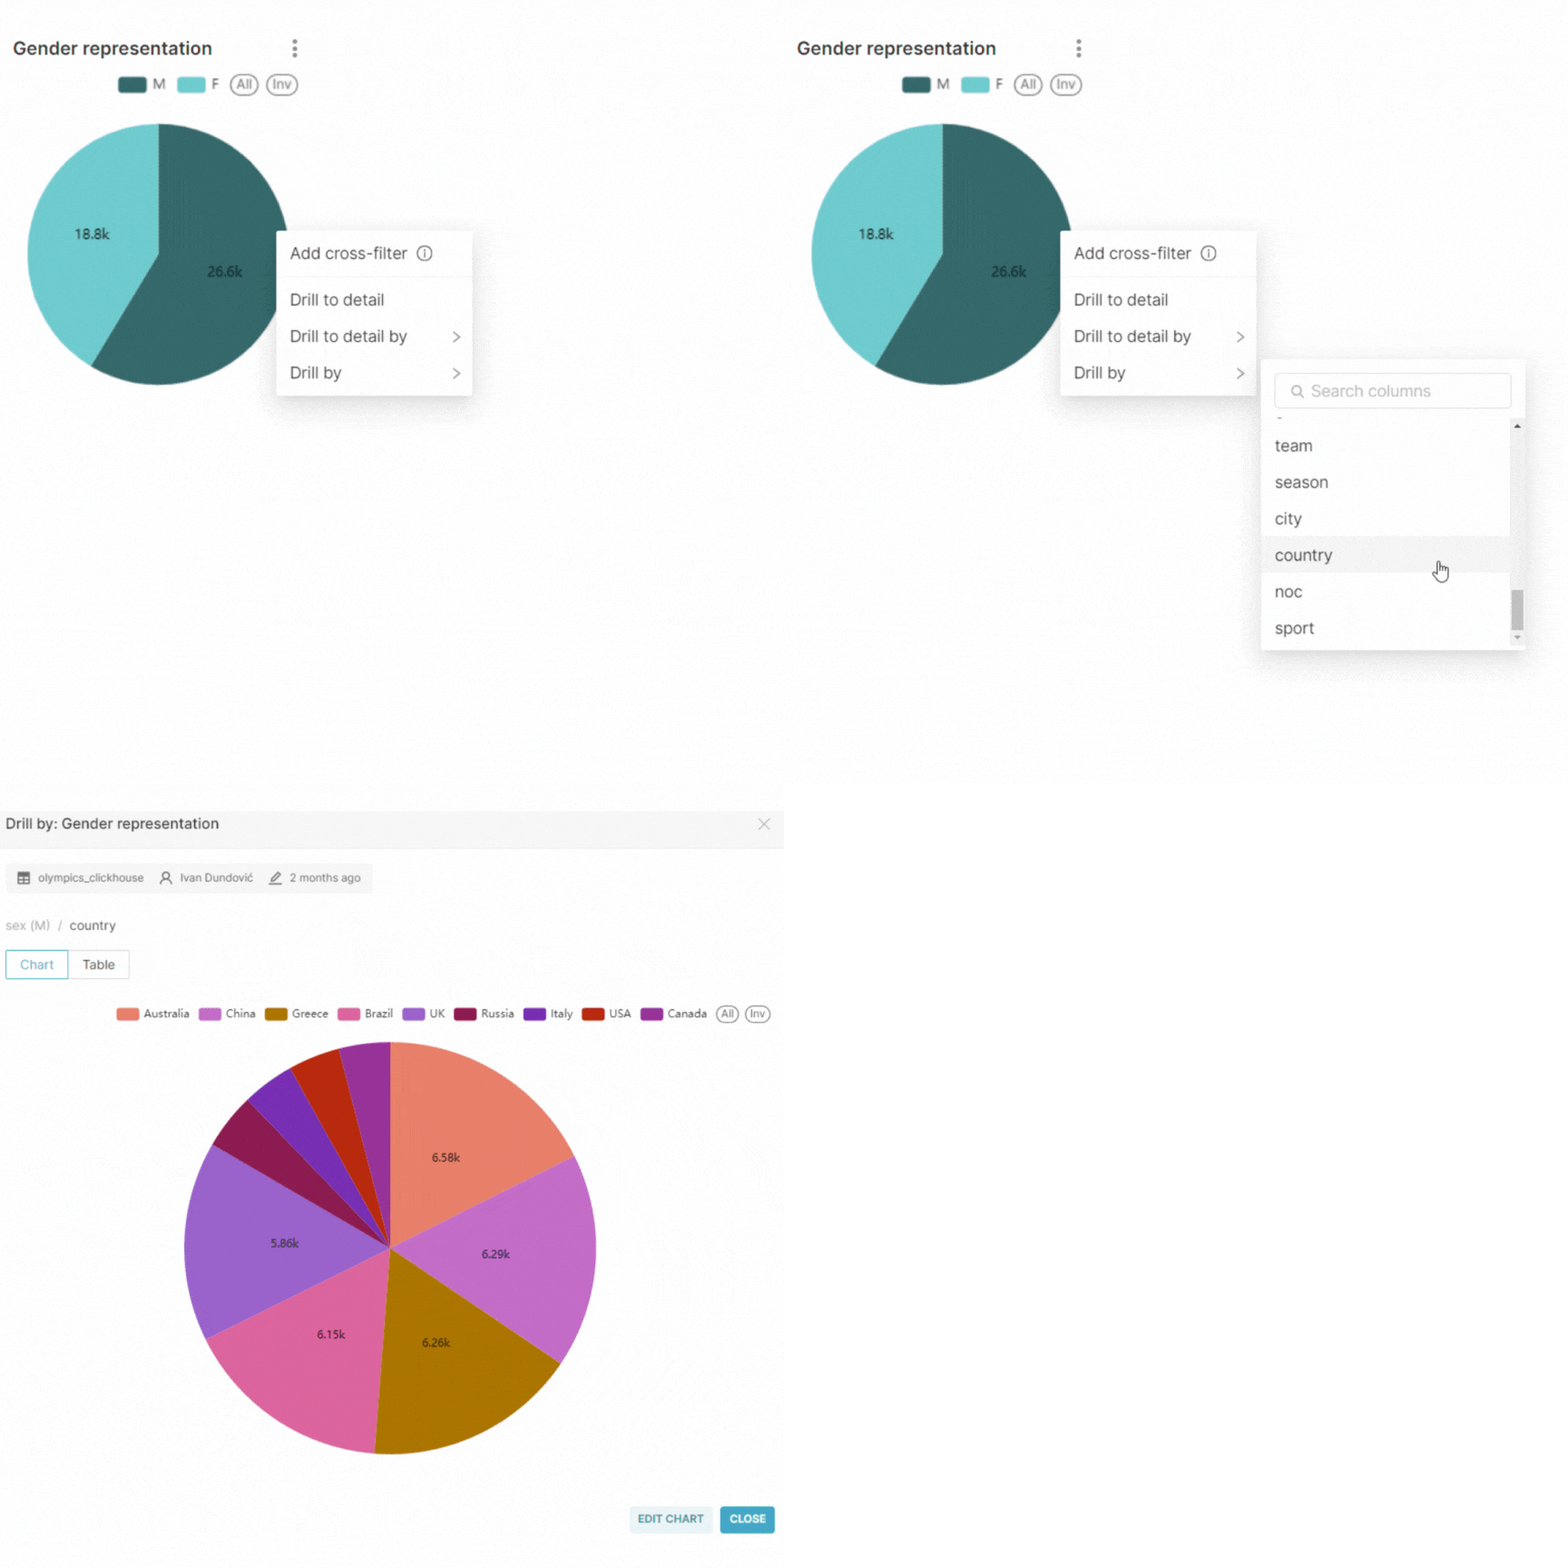
A notable upgrade that set Superset apart from other visualization tools is the so-called “Drill by” feature, available on various charts. By right-clicking on the visualization, users can access the “Drill by” option, allowing them to select a table column for a more granular view. In theory, the user can generate a new chart with lower granularity in just two clicks. In the example below (Picture 2), the user obtained a breakdown of the number of men participating in the Olympic Games from 2000 to 2016 by their respective countries using the “Drill by” option.

Another way to interact with the dashboard is through cross filters. In essence, users can select a data element from a visualization (e.g., a table row) and it will propagate as a filter across eligible visualizations, enabling ad-hoc insights into the data.
One feature that would be nice to have is the ability to create visualizations across multiple tables. In Superset, each visualization can only be created based on a maximum of one table. While there is a SQL Lab, where users can create virtual datasets by combining data from multiple tables in the database, it requires knowledge of SQL coding. Nevertheless, for users who for example have their data stored in Excel tables, SQL Lab remains a practical and fast option for extracting and customizing the necessary data.
An important aspect of any visualization tool is the ability to define security, covering both the created dashboards and the data itself. Superset offers predefined user roles and permits custom roles creation. Furthermore, Row Level Security is facilitated on a separate page within the application, ensuring straightforward data security management.
Upcoming Horizons with Superset
When considering current approaches to data usage, it becomes evident that there is a growing need for predictive and real-time analysis. In this context, it is worth noting that Superset supports time series forecasting. Users can configure how far into the future they wish to view predictions and at what level of statistical confidence. Regarding data monitoring, users can set up automatic alerts and reports within the application, which can then be sent via email or Slack channel.
Overall, it is fair to say that Superset is a tool worth keeping an eye on in the future. Given its significant advancements in recent times, from our perspective, it certainly generates positive expectations.
In case you would like a demo, even with your own dataset, feel free to reach out to our data engineering team.
Falls Sie Fragen haben, sind wir nur einen Klick entfernt.


