2020 – what a year, right? While everything was being cancelled, the CROZ Summer Accelerator stood tall. Online or offline, the show must go on. Until now, you could have read how other CROZ Summer Internships went, and now it’s time to get a brief overview of the Data Engineering Internship at CROZ. So let’s start.
What did we do in three months?
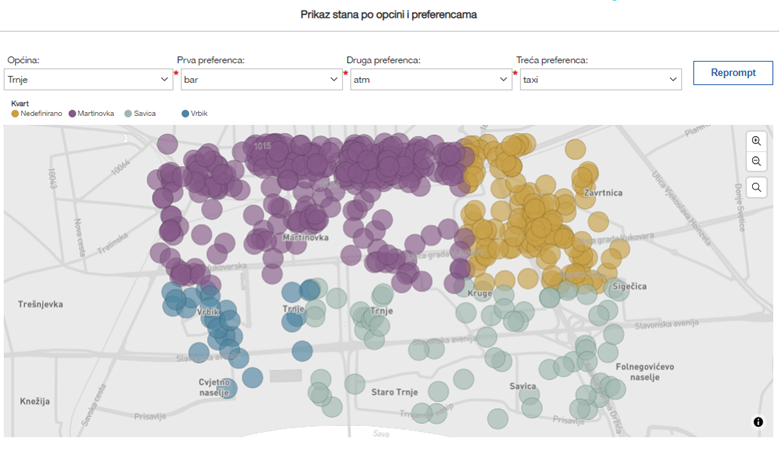
Our task for this internship was to learn about Zagreb through data. To achieve that goal, we used open-source data which could be divided into three datasets by categories: points of interest, apartments, and statistical data. By connecting these three datasets, we wanted to help people find an apartment that suits their needs or give them more insight into their neighborhood. For example, in the image below, you can choose the three most important points of interest that you want to have around your apartment, then the dashboard will show you all apartments that have all of that. Although most of us interns have lived in Zagreb all our lives, we also found out some fun insights about Zagreb or tested well-known prejudices about some neighborhoods in the process.
How we did it
Ready!
In the beginning, we had a two-week training to have the same knowledge base in data engineering. We learned basic and advanced SQL with an emphasis on differences in databases like Oracle, PostgreSQL, and MySQL. After we learned how to deal with data, we learned the basics of BI and DWH. It was like a short and efficient course with a lot of tips and tricks and best practice examples that our mentors learned through many years of experience, and you definitely can’t get that on an online course. Besides data knowledge, we participated in other educations where we learned how to use Git and the principles of agile development. Also, every week we could join a 15-minute education on a random topic: from social skills to development stuff.
Steady!
Then we buried ourselves in data scrapped from different sources: Open Street Map, data.zagreb.hr, Airbnb, and Croatian Bureau of Statistics. We joined all our strengths to analyze all that data. We had a little help from IBM Cognos Analytics explorations that uses AI to explore data and, as a result, you can get analytics insights that are not so obvious. When we were familiar with the data, we started writing use cases. In that process, the diversity of teammates thinking came to the fore and added additional value to the project. Based on defined use cases, we started modeling our DWH dimensional model that will later enable an easier way to retrieve information and generate reports.
GO!
In this phase we had to get our hands dirty. But we did it! As the well-known saying goes: garbage in, garbage out, the same goes for data. Data gathered from various sources were screaming garbage, so the cleaning process started. That took us almost 80% of the internship and included a transformation of data (ex. dropping columns, converting data types, data quality, adding system columns, and so on …). We used IBM DataStage, that is an ETL tool which extracts scrapped data (.xlsx, .csv), transforms and loads it to our DWH model. It’s a graphic tool for creating jobs for moving data from source to target system, and it made our life so easier. One of the biggest obstacles was the data that was missing, i.e. for some records we had geolocation points while for other just addresses. Geolocation points were very important, because what is the best way to show geographic data than maps. We overcame that obstacle with a Python script that populated missing values. After data visualization with IBM Cognos Analytics, we were able to tell the data-driven story through interactive reports and dashboards and presented it at the Show-off.
The Magnificent Six
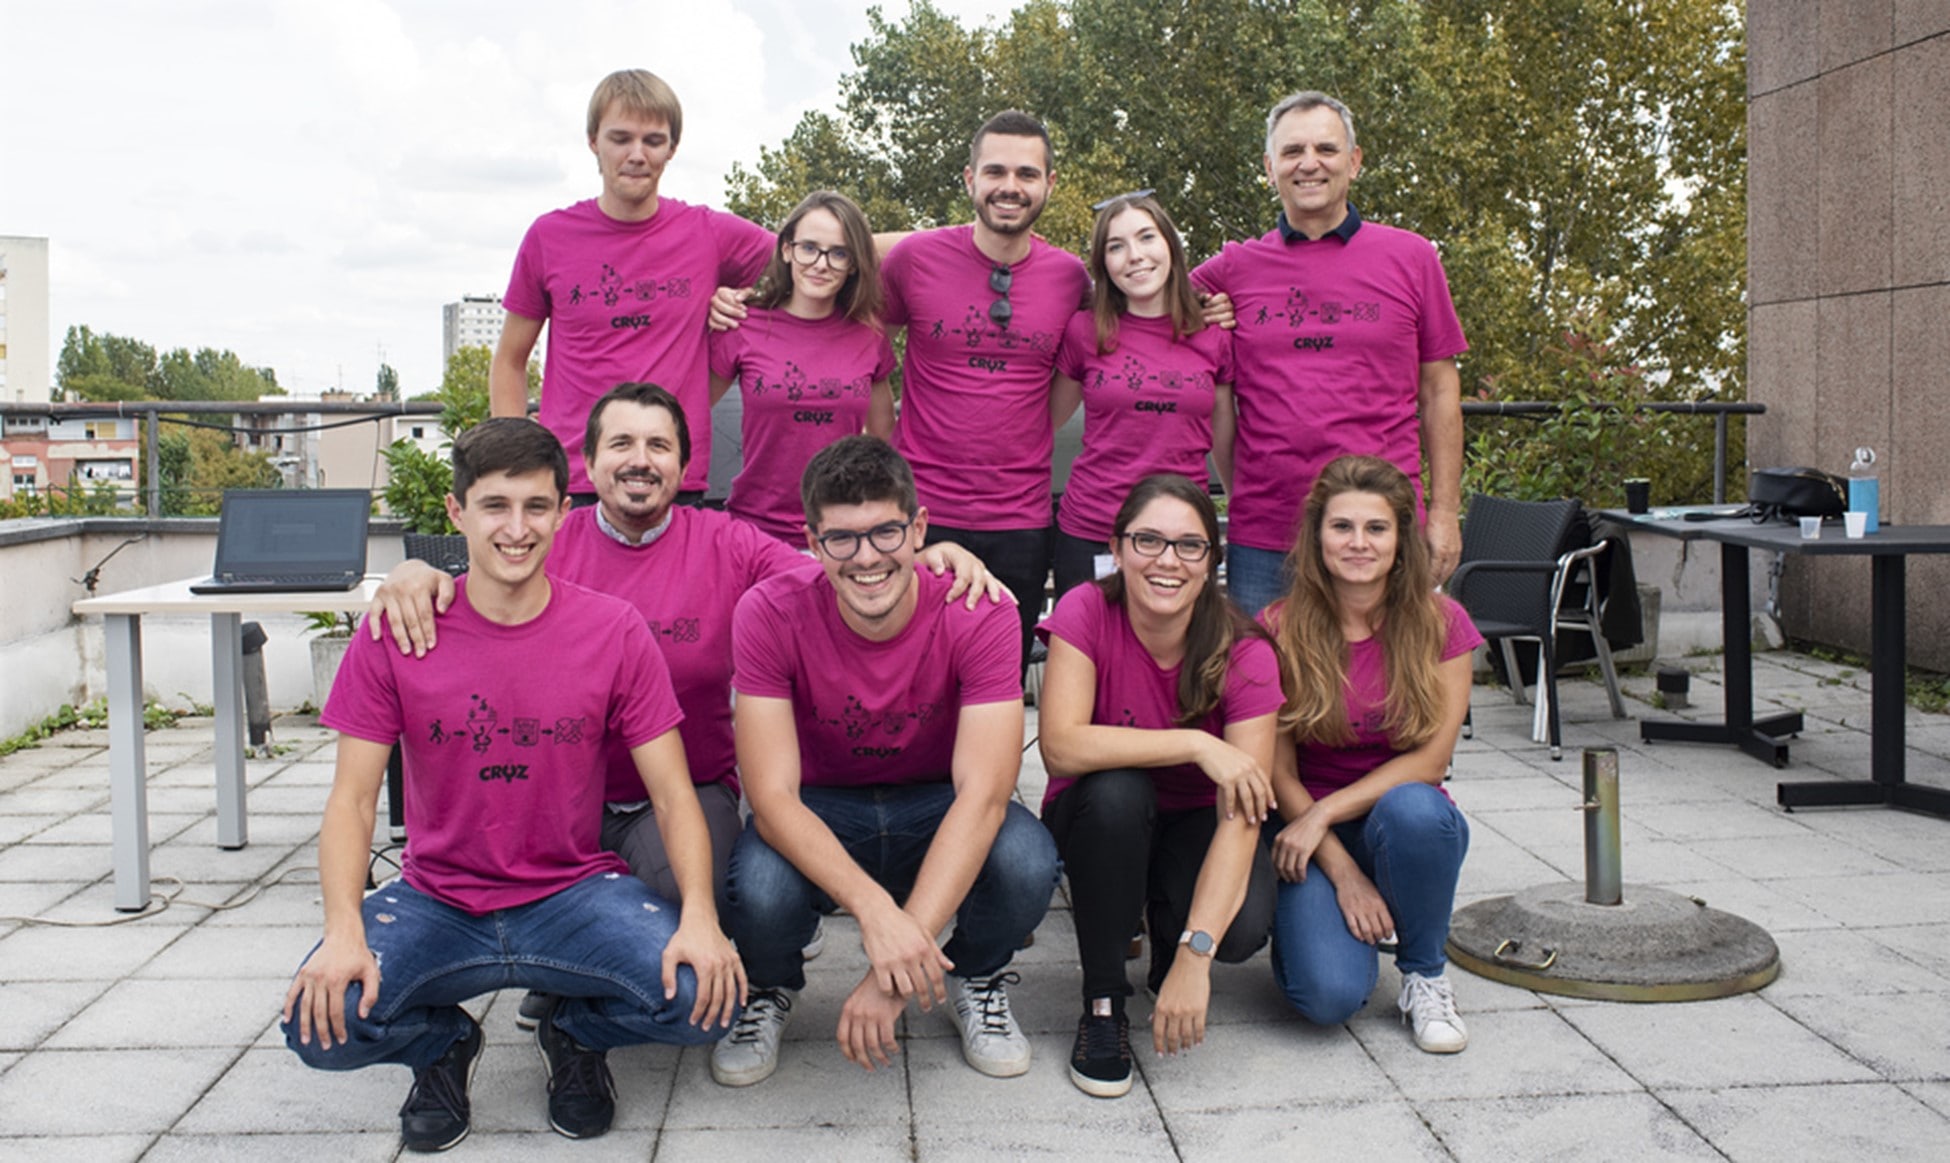
All this would not have been possible without excellent teammates. We worked together on the project, from data analysis and ETL process to visualization at the end. Besides that, we all found our way of utilizing our skills and talents to improve the project. Kiki was our salesman who knew that the best business deals are made on the golf field, along with being an expert for (on) numbers. And where there is a sales specialist, there is also a marketing specialist, so our worldwide Bruno with Photoshop skills made our product recognized as a brand – if not in the world, at least in CROZ! The most important part, though, is to have a good product. Paula, a big lover of animals and animal rights, couldn’t help herself not to notice every bug in our project to make it perfect. There was also Juraj, a master of Python who could save your life or at least make it easier. Last but not least, Davidovski, well known in CROZ, with a Ph.D. in table football, and a player who saves the match and also always comes up with new ideas for the project. I’d had some experience in the data world, so I was familiar with the do’s and don’ts (well, mostly with the don’ts) of data engineering. That helped us to do tasks more effectively.
As you can see, our mentors put together a mix of everything, with a wide variety of personalities and knowledge. But we learned how to work together and join our forces to successfully overcome all challenges. Finally, we were proud to see the result of our work through data visualization and presenting it to others on the Student Show-off.
Final note
If you’re worried about your lack of knowledge in data engineering, don’t fret. We’ve all started with different levels of knowledge. Some of us did not have any experience with data engineering technologies, while some did. The important part is that you show interest to learn.
If you want to feel accepted, understood, and stimulated for new challenges, apply for CROZ Summer Accelerator. You won’t regret it!
Falls Sie Fragen haben, sind wir nur einen Klick entfernt.
