R SHINY – Shiny side of data story
R is a free software environment for statistical computing which also supports tremendous graphs, maps, tables and other visualizations. R is also an extraordinarily soft and accessible tool when it comes to visualization building.
Among other things, R contains a powerful Shiny package which creates interactive web applications and dashboards, that can contain various tabs with timeline geographic visualizations, colorful graphs, tables with many features, dynamic pivotal tables created directly by end-user through simple clicks and various other objects. Jumping action from a particular map section to a filtrated list of data at the lowest level can also be built. It’s so powerful that you can even build a game.
Before you start reading about R Shiny’s settings and features HERE you can find a demo of the application built in R.
Comparison to BI tools
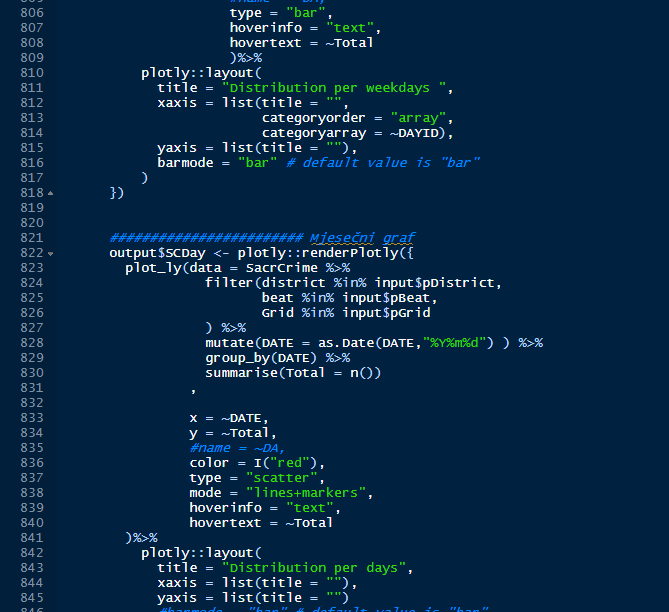
As a result of custom programing you can also extend your Shiny apps with CSS themes, html widgets and JavaScript actions which gives richness to application’s fully customized picture and interactive power between objects. All these extra features give comfort for better creation of various sophisticated and stylish user requirements on any device.
Compared to other BI tools that are limited with predefined rules, Shiny can easily deal with much more problems thanks to its custom approach. For example, in other BI tools some tooltips are not provided, most graphs don’t provide color changing or sorting bars, etc.
Technical side
Thanks to R custom programing, Shiny blends R’s power with the interactivity of the present-day web application. Shiny applications are combined of two fixed named units, a user interface object as frontend and a server function as backend. Those two are passed as arguments to shinyApp function which creates a Shiny app. User interface controls design and appearance of your app, while server contains the instructions which your computer needs to build the app. Also, R helps you to spotlight the more important part of the code with its reactive programming, which consequently removes chaotic event handling code.

Why use Shiny?
When asking for visualizations, most users demand graph flexibility and ability to go deep into data with smart filters, sliders and other. R Shiny is the right tool for this as it can meet such requirements. Based on the fact that its best feature, as mentioned before, is reactivity. With reactivity option user can input values and change visualizations using a variety of widgets, including customizable slider widget with built-in support for animation, sliders and various boxes. Dashboard is completely refreshed in the blink of an eye! This allows the end user to go with the data flow in a way that other solutions cannot provide.
R Connectors
As a basis for creating applications, we need data which, when using R, can come in any format. Why any format? Well, R is capable of processing most kind of data (even in the application itself!), and allows different ways to manipulate tables and data.
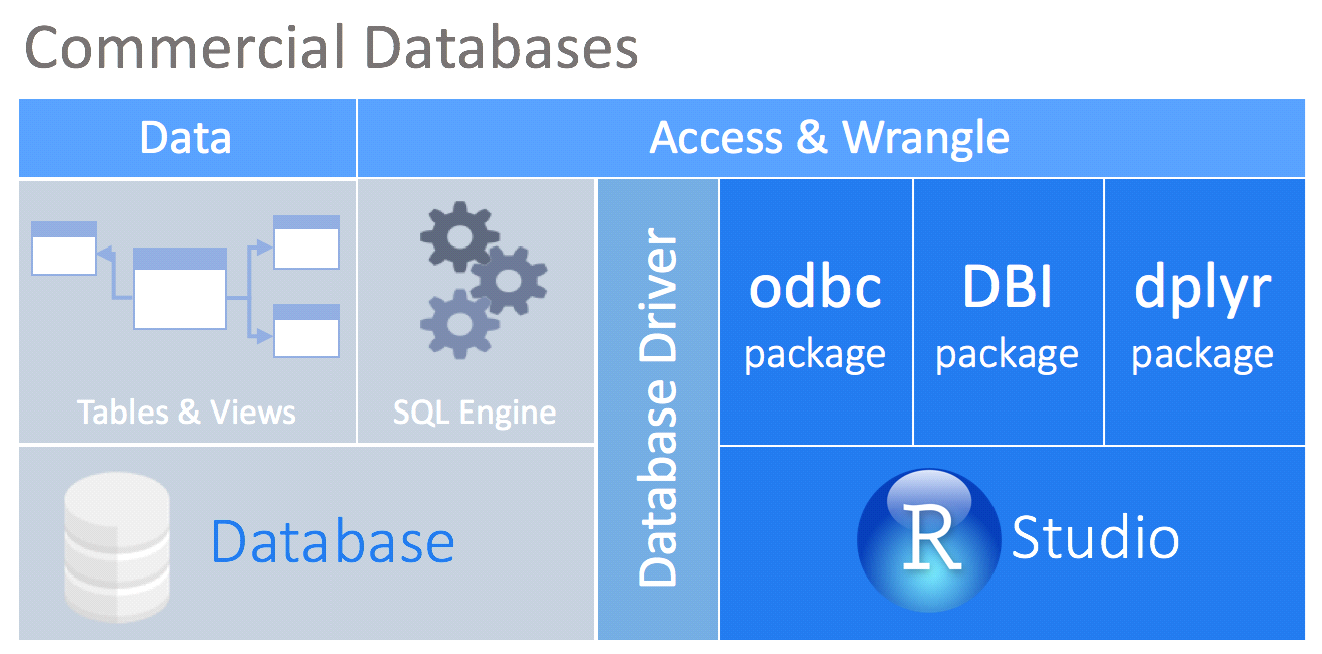
Except for standard data retrieval through Excel or csv, R supports fetching data from different databases using drivers and custom queries, such as:
Oracle, MS Sql Server, Teradata, PostgreSQL, Redshift, Salesforce, MySQL, MonetDB, SQLite, Big Query, Athena, Hive, MongoDb, Netezza, Cassandra and others.

Picture from https://db.rstudio.com/odbc/
Publishing Shiny Web Apps
RStudio is R’s integrated development environment (IDE) and provides open source and enterprise-ready professional software for data science. RStudio also puts your Shiny application online how it suits you best.
You can publish your apps on-premises using Shiny Server Open Source or using commercial RStudio Connect or you can publish it to the cloud with Shinyapps.io. You can find capabilities of each platform here.
If you want to know more about this or related topics or you need some help with your data, feel free to get in touch with our data engineering team.
Photo by Markus Spiske on Unsplash
Falls Sie Fragen haben, sind wir nur einen Klick entfernt.

