CROZ BI solution for IBM ELM is a comprehensive analytics solution that integrates data from different ALM sources like IBM RQM, IBM RTC, IBM DOORS as well as others. It prepares the data for analytics and exposes it to the business intelligence or reporting platform of your choice. Our solution allows flexible reporting on any data contained in IBM ELM or any third-party system integrated with ELM.
CROZ BI solution for IBM ELM main features
- You can get all the data from RTC, RQM and DOORS with our custom scripts
- Enables you to import additional attributes from operational ALM systems that are not necessarily included with default integration options
- Ability to integrate additional data sources (databases, XLS files, etc.) that You may need to combine data for Your organization’s reports
- Open for any reporting/BI platform by serving the analytics data layer from Data Warehouse, thus giving flexibility of report creation and analytics
- Reporting capability on any system integrated with ELM (e.g. legacy ALM systems or in-house developed system)
- Ability to add new drill-down paths in reports and customize reports to suit your needs
- Scalable system requirements based on your reporting requirements
- Fraction of a cost compared to enterprise tools
Get in touch to find out more how CROZ BI solution can help your tech and business needs or keep reading for more detailed info.
Application Lifecycle Management
Application Lifecycle Management (ALM) refers to ability to integrate, coordinate and manage different phases of the software delivery process. ALM is basically a merger of disciplines involved in software delivery process. Since ALM is a framework, it can be used with any development methodology, but principles of integration, collaboration and visibility always remain true.
ALM tools provide standardized environment for communication and collaboration between development teams and related departments such as testing and operations. There are many tools on the market that offer horizontal integration and work well together in the same step of the lifecycle. However, ALM tools should be able to integrate not just horizontally, but also vertically, connecting governance, development and operations into an integrated whole.
IBM Engineering Lifecycle Management
Engineering Lifecycle Management (ELM), formerly known as Collaborative Lifecycle Management, is an ALM solution by IBM built on Jazz architecture. It consists of Rational DOORS (requirements management application), Rational Team Concert (change and configuration management application) and Rational Quality Manager (quality management application) delivered as a set of applications with Jazz Team Server. Through their integration, work done by analyst is connected to development and testing teams.
A set of built-in reports that are based on Business Intelligence and Reporting Tools (BIRT) is available with the standard installation of ELM applications. They are designed to be deployed into projects and run as-is. This set of predefined, out-of-the-box reports covers common reporting scenarios. IBM also offers Rational Reporting which is an optional installation available with ELM. It provides an additional set of tools and development intelligence reports that can be run as-is or customized.
Why CROZ BI solution for IBM ELM?
User experiences have shown that IBM ELM isn’t always able to live up to user expectations and satisfy its users’ increasingly complex needs. ELM makes it difficult to integrate with tools outside the IBM technology stack, limiting the ability to integrate with the tools the teams want to use. The lack of integrated test management and execution in IBM DOORS hinder traceability from requirements all the way through to testing, making it a less than ideal choice for projects where being able to show the chain of work items is key to compliance. Furthermore, reporting against DOORS Classic is not sufficiently supported by Jazz Reporting Services and Report Builder. The data that you need is there, but getting it out and into a format that a customer will accept is hard to do. There are limited possibilities to develop custom reports with Report builder which affects their usability as a decision making tool. This is where CROZ BI solution for IBM ELM comes in.
Architecture and capabilities
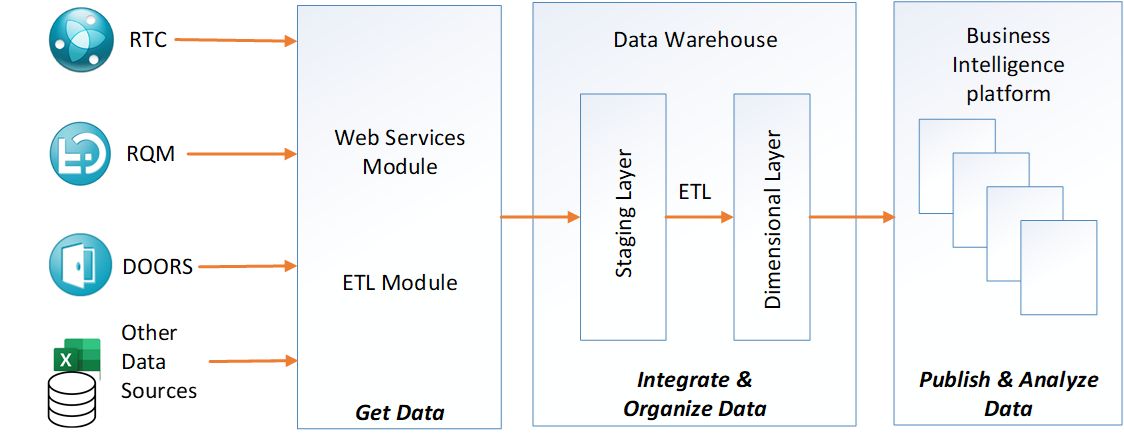
Our integration scripts use ELM OSLC and REST APIs to get all the necessary data to the staging layer of our data warehouse (DWH) and to establish links between different systems and their artefacts. We can get either all of the data or portion of the data necessary for specific reports which would provide lightweight reporting solution. Also, data sources are not limited to CML applications. The ELM data can further be combined with data from other sources such as excel spreadsheets to complement ELM data. For example, Verification progress burn down report can combine RQM data with user defined measures from excel file, such as forecast, target or expected average number of tests run in a week.
Data warehouse data makes it possible to report on trends, aggregations and other relationships among data. Data is collected from ELM applications, then stored in the staging area of data warehouse where it can be transformed to represent a variety of relationships.
Relationships between tables can be predefined as in ELM or tailored to customer’s needs especially in regard to integration with other data sources. Staging area contains data from all the data sources in one place.
The raw data is then transformed to dimensional model and loaded to corresponding dimensional tables and ultimately metrics tables. Since data needs to be extracted, transformed and loaded to usable format before it can be consumed by various reporting tools, this process isn’t done in real time. User’s reporting requirements and available system resources are the main deciding factor for data refresh intervals.
The data warehouse has multiple metrics tables. The data in each metrics table is organized as a star schema, consisting of a centralized fact table and related dimensions. Each dimension represents a single entity (e.g. test case) and contains a set of attributes that describe that entity (e.g. title, owner, etc.). The fact table contains quantitative data – numeric or aggregated. Dimensions are linked to the fact table in a star pattern that reflects different attributes of an object being represented. Fact table that contains data at the lowest level can be used to load aggregated data into data marts with pre-calculated measures for specific reports.
ELM data is loaded to DWH once a day in incremental delta loads which enable us to track changes on daily bases. Our solution also supports Change Data Capture (CDC) mechanisms to keep the track of changes on key attributes and potential broken links between integrated systems. During the data load, we can compare new data with the existing data in our data warehouse and identify changes as a result of insert, update or delete operation. Based on those evaluations, we keep the data synchronized with the sources and track changes through time.
CROZ BI solution enables you to visualize Test coverage progress, Defect trend graph, Verification burn down, Test case state over time, Defects per requirement or to create any report of interest based on available data on reporting platform of your choice. You can use reports to view and analyze information on a variety of application and cross-application metrics, relationships and trends. Our reports also enable you to drill down on aggregated data so that you can see all of the individual values that make up the data.
Get in touch to find out more how CROZ BI solution can help your tech and business needs