Imagine having thousands of processes in your data warehouse with millions of data. How would you know which processes are critical? Which process consumes most of CPU or memory resources? Which processes consume and produce large amounts of data? What to do to find out? The answer to all these questions is SLA.
Service level agreement, mostly known by its acronym – SLA, is a level of service provided between the service provider and a client. With SLA, you agree to certain aspects of service such as quality and availability, but you also agree on responsibilities. From a technical standpoint of view, in SLA there will often be definitions such as mean time between failures, mean time to repair, or mean time to recovery.
In this article, I will show how SLA logic can be implemented based on a project case I did for job monitoring in IBM Datastage.
First and foremost, you have to identify which metrics you want to monitor and how. Obviously, the first thing that comes to mind is a duration of a certain job. But what else can you monitor and where do you get your data from?
If you are working with IBM Datastage, then you get your data from the Operations database (DSODB) designed as a relational schema whose tables contain information about job runs and system resources used on a system that has a DataStage engine installed. It includes the monitoring of various metrics as well as key operating system metrics such as CPU usage, free memory, and disk space so you really have a gold mine in terms of implementing SLA based on it.
After identifying the metrics for monitoring, the next step is doing calculations that will help determine the status of a certain process, or, in this case, a job. The idea is to have SLA status based on every metric which indicates the level of criticality. How to accomplish that?
You can set two limits: warning and alert. For warning, take the average value and set it to 10% more than the average, and for the alert take 25% more than average. Some of the metrics may not fit these criteria so you will have to make calculations that suit them. For example, if some metric is measured in percentage then we don’t need the average value; instead, we multiply 100 with a decimal value we want to set as a limit, e.g.: 100 * 0.8 = 80%.
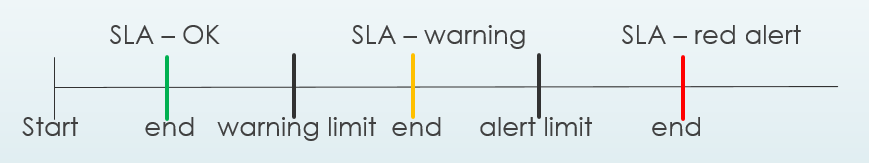
Now it is easy to determine SLA status based on the limits. If the metric value is less than the warning limit, then the SLA status of the job is set to OK. If the amount of the metric is larger than the alert, then the SLA status is set to a red alert. Otherwise, the SLA status is set to warning as can be seen in the illustration below.
If some of the jobs have SLA status set to warning or red alert, it would be wise to know for how long they have been in that status.
To understand this better, let’s take a look at an example based on a duration of a job. Let’s say that we have a job with an average duration of 1 hour. The warning limit for that particular job would be set at 1.1 hours and the alert limit would be set at 1.25 hours. If the job took more than 2 hours, which excels all the limits, the job would have an SLA status set to red alert, with 0.75h spent in that status.
Benefits of having such an automatic system of monitoring were visible from the very beginning. On a daily basis, we are now conducting a number of different analysis such as the top 10 jobs that spent the longest in SLA status red alert, how many jobs were in the SLA warning/alert status, jobs with the highest physical memory and CPU consumption, jobs with largest input rows consumption regardless of SLA status, etc. This enables us to immediately spot the most critical jobs and take further actions if necessary.
I’ll give you one example from a project I’m currently working on. There are multiple jobs that keep constantly “popping up” with the SLA status set to red alert because of high physical memory consumption. When we looked into that, we noticed that they run in parallel, and each day they have to process a large amount of input data which obviously leads to very high physical memory consumption. The solution that can be implemented is to simply put them to run in a sequential mode rather than parallel.
Well, we have SLA and we are finally able to monitor and detect critical jobs but as developers, we are constantly looking for solutions that are going to advance our data warehouse even more. So, where do we go from here, and is there anything that could possibly improve data monitoring even more?
The answer is in anomaly detection and predictive analytics. Anomaly detection is the identification of rare items, events, or observations that raise suspicions by differing significantly from the majority of the data. What is great about it is that you can use unsupervised machine learning algorithms which enable detection of any type of anomaly, including the ones which have never been seen before. It also allows you to fully automate the process of anomaly detection. You can track point, contextual, and even collective anomalies so any type of unusual behavior or any sudden spike in numbers would be caught immediately because outliers don’t lie. You can also define your own threshold values on top of the metrics you already have in SLA which would give you an even more in-depth analysis.
Predictive analytics uses a variety of methods and technologies such as big data, data mining, statistical modeling, and machine learning. With predictive analytics, we can estimate or predict future outcomes based on both current and historical data. It also provides a better assessment of what can happen in your data warehouse and it can also exploit patterns contained within data in order to detect possible risks so that you take further actions accordingly. In the context of the project I’m currently working on, pattern recognition would be of huge value because we have daily increments of data.
In a large data warehouse, we would never have noticed and recognized critical processes, especially if we had daily increments with thousands of jobs. The good thing is that we don’t have to do that. Instead, we can implement a system that detects what is happening in the data warehouse on daily basis. No more bad jobs in my data warehouse, I can tell you that.
Illustration: Stipan Tadić