About IBM API Connect and observability in general
IBM API Connect is an integrated API management solution, where all the steps in the API lifecycle are performed within the solution.
API Connect has four major components: API Manager, Analytics, Developer Portal, and Gateway. These four components can be deployed in a variety of hybrid and multi-cloud environments. IBM API Connect is deployed as multiple pods with microservices implemented in various languages and technologies.
Since we know that APIs are especially important nowadays and API Connect should be monitored well, we decided to use Instana – IBM’s advanced Observability solution.
In general, observability is the extent to which we are able to understand the internal state of a complex system based on knowledge of its outputs. The more observable the system, the more quickly (and accurately) we can navigate from the identified performance and availability problems to its root cause.
Observability also refers to software tools and practices for aggregating, correlating, and analyzing a stream of performance data from a distributed application along with the hardware and network it runs on, in order to monitor, troubleshoot and debug the application and the network to meet customer experience expectations, service level agreements (SLAs) and other business requirements more effectively.
So…how to monitor API Connect using Instana?
To monitor API Connect successfully, you need to take into consideration the following monitoring areas:
a) Infrastructure monitoring
b) API Connect – specific monitoring
Instana is a very powerful (and easy to use) observability solution that provides several perspectives and methods to be able to analyze how well the API Connect environment works. So, let us see what we have.
1. Infrastructure monitoring of API Connect
Instana agents collect the infrastructure resource metrics automatically.
Components of API Connect can be monitored on multiple levels:
1. OS monitoring (CPU usage, Context switches, RAM, storage, process CPU and memory usage) for worker and management nodes, node availability
2. Docker container monitoring (CPU, Memory usage considering the docker container settings and limitations, container availability)
3. Kubernetes-level monitoring, including:
- Deployments health
- Kubernetes services health
- Component status
- Log analysis (via Instana Analytics, which can be used for detailed querying of the logs)
2. Developer Portal monitoring
Instana’s JavaScript agent exposes an API that your website can interact with when the Instana EUM Drupal module is enabled. The data is collected from user interaction and is presented in an Instana dashboard.
- Portal availability and health
- Load time
- Top page views
- JS errors
- Page Loads vs. onLoad Time
- Resource loads and retrieval time
- HTTP requests success rate, error types, and latency
- Geographical distribution of requests
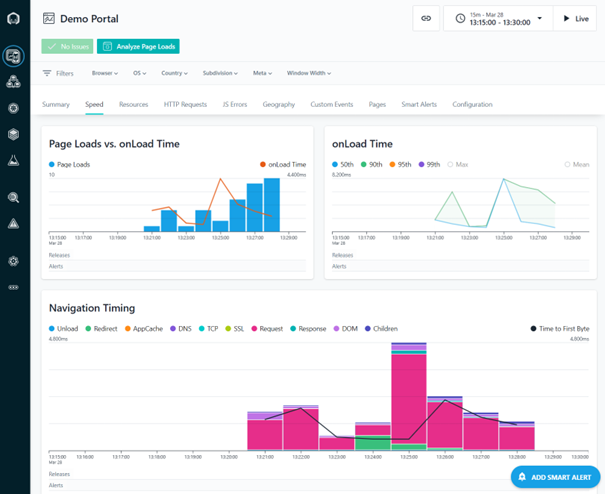
Portal monitoring using Instana EUM Drupal module – performance parameters
3. Gateway monitoring
Instana DataPower agent can be used to monitor the APIC Gateway component. DataPower tracing capability can be used to dive into the details of how the API is invoked.
DataPower agent Metrics:
- Data Power CPU usage
- Data Power memory usage
- System load
- Encrypted filesystem usage
- Accepted Connections
- Calls and HTTP status codes
- Latency
- Processing time
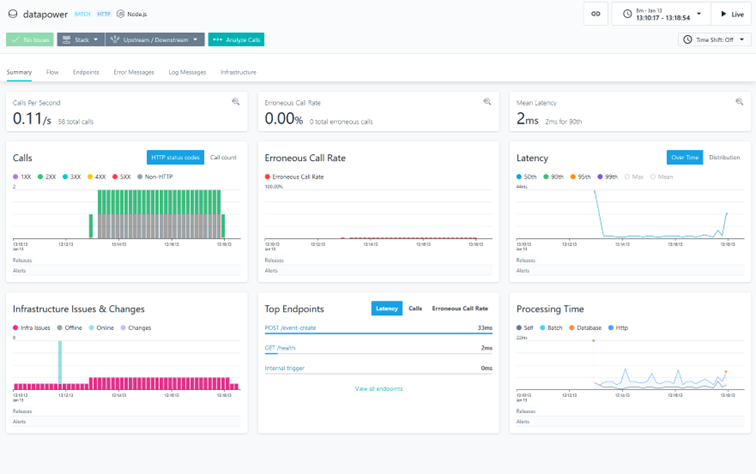
Datapower monitoring dashboard
4. Application monitoring perspective
Instana offers application monitoring, where you can group discovered services into applications (it’s more complex than that, but good enough for now). For example, the namespace can be used for the configuration of the application view. This is very useful to get a good overview (with drill-down analytical features) to see how the application behaves, were there infrastructure changes and when, what are the service dependencies, communication patterns, logs, and errors in the logs.
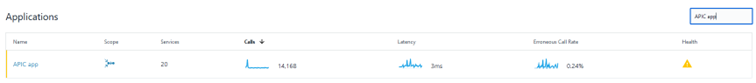
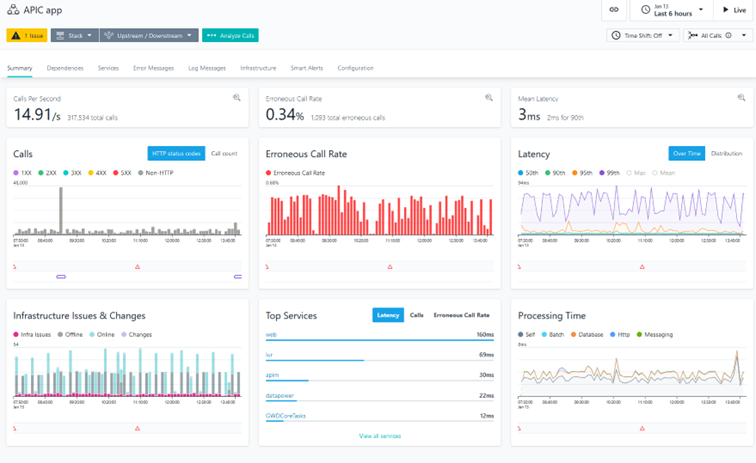
API Connect monitoring using Instana application perspective
Instana can be used to monitor error messages and calls and drill down to get more details about calls.

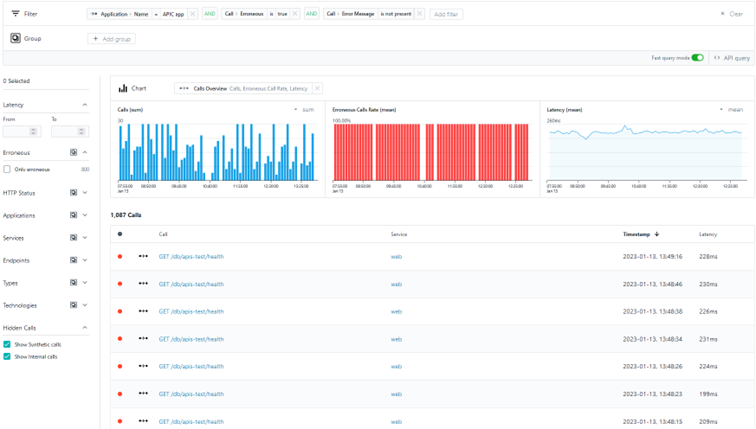
Log analysis using Instana
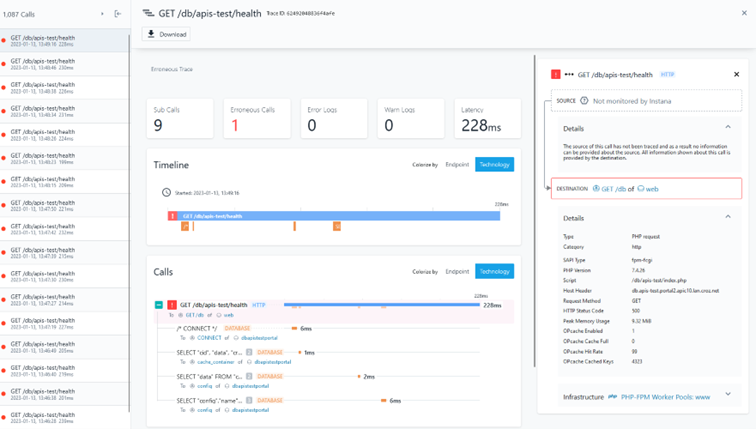
Calls drill down
5. Synthetic monitoring
Synthetic monitoring is a method that simulates user actions to test an application or website’s functionality. This is a relatively new functionality in Instana (and we are very happy to have it ).
As part of Synthetic monitoring, we can use scripts to simulate user interactions based on geographic location, network types, different devices, and more. This gives you insight into application uptime, problems users might face when using your interface, system outages, and general software health.
Three main types of synthetic monitoring assist in troubleshooting potential errors in your network. These are availability, web performance, and transaction monitoring.
- Availability Monitoring
Availability monitoring is used to check that different website features and functions are available to the application user. Some examples are checking response time or performing API calls (this is especially interesting for API Connect).
- Web Performance Monitoring
Website monitoring checks for page load time, website performance metrics, and response times. This includes finding errors for mobile monitoring and multi-browser monitoring.
- Transaction Testing
This is a more complex form of synthetic monitoring. It is a machine that can run a script that performs (business) transactions. It is smart to use the script in such a way to ensure users can complete submissions by simulating the experience of going through checkout and filling out forms.
There are also two types of synthetic tests: browser tests and API tests.
Browser tests simulate user transactions with a robot customer, while API tests use different endpoints across different layers of an application infrastructure.
Instana Synthetic Monitoring provides a fully integrated solution with other Instana capabilities. It allows the creation of Synthetic test to monitor an application.
Synthetic PoP (Point of presence) is the agent where the synthetic tests are executed. It runs as a set of Kubernetes pods in the Kubernetes cluster.
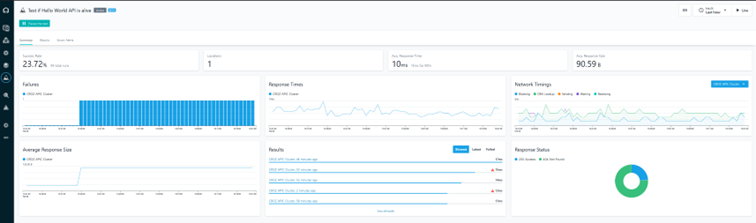
Synthetic monitoring of API Connect Hello World API
Conclusion
Our Observability team in CROZ has experience with many different monitoring and observability technologies in the last 20+ years: IBM (previously Candle) OMEGAMONs, IBM Tivoli Monitoring v5 (yes, the one Tivoli Framework based) and v6, ITCAMs, IBM APMs, a set of open-source technologies like Prometheus or Grafana Mimir.
We also have an extensive experience with IBM API Connect, including installation, configuration, developing APIs, and migration between versions and are well aware of the importance of it in our customer’s environments.
In my opinion, Instana is one of the crown jewels in our observability portfolio – it’s versatile, simple to use, quick to deploy, easy to maintain and powerful in the monitoring of diverse, comprehensive (and growing) set of systems, middleware and applications. If you would like to observe your API environment, it’s really something you should check out.