
Find out:
- Why is even Amazon using Deequ?
- Can data preparation with Deequ Check be executed in fewer steps than with Python? Check out our side-by-side comparison!
- What’s a good trick to detect outliers?
- How to avoid the data processing workflow to abort?
Large amounts of data come with equally large volume of dirt. Unknown or missing values, duplicates or misspelled entries can cause data processing workflows to crash or result in poor business decisions. Those in the technical field will be familiar with the GIGO concept – Garbage In, Garbage Out. If the input data is bad from the beginning, the expensive licenses for statistical tools and data visualization software are not going to magically turn a pumpkin into a carriage.
Christopher Columbus miscalculated the distance between Spain and Japan because he used Roman miles instead of Arabic miles in his calculations. Armed with bad data, Columbus embarked his voyage on a 25% smaller Earth and discovered the Americas by accident! [1] A lot has changed since 1492, but garbage is still piling, both digital and plastic.
Data Quality is often neglected in business processes. According to the Gartner article published in June 2018, “Recent Gartner research has found that organizations believe poor data quality to be responsible for an average of $15 million per year in losses.” [2] Data Quality is an essential part of a data processing workflow. Data should be correct, unambiguous, consistent and complete.
Validate and verify
Logical points for data quality assessment are at the beginning and at the end of a data processing workflow.
- Data has not yet been cleaned or processed. This is the perfect time to check data for flaws. If data contains errors, it can be fixed before entering next stages of processing.
- Data transforms through the workflow, therefore it should be verified and/or validated again after workflow completion.
Validation is checking that the data satisfies specified criteria.
Verification is checking for accuracy and inconsistencies after data migration is done. [3]
“Deequ is a library built on top of Apache Spark for defining ‘unit tests for data’, which measure data quality in large datasets.” [4] Deequ is available as open source and is used internally at Amazon for verifying the quality of many large production datasets. [5] [6]
Since Deequ is a relatively new tool, I will present a rough side-by-side comparison using popular Python libraries (Pandas, Matplotlib). Only snippets of code will be shown with their respective labels (Python, Deequ). Both Python and Deequ codes were executed in a Zeppelin notebook, on the same dataset. If you are interested in how to implement validations with Deequ, there are a lot of examples on their GitHub page. [7]
Diamonds or rust?
Before defining rules for validation, it is best to explore and analyze a new dataset.
Data containing information about employee travel orders has already been imported into a DataFrame.
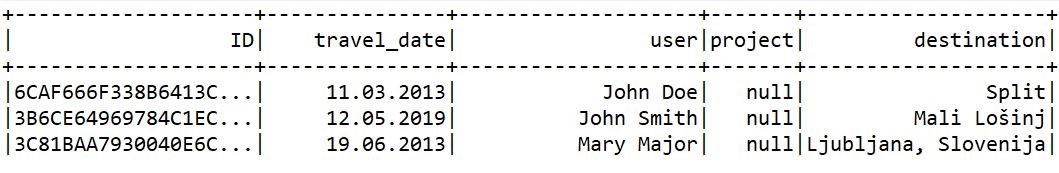
1. Explore data
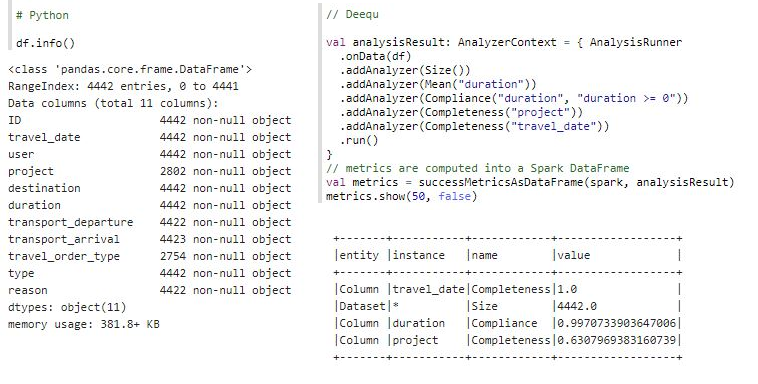
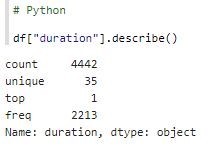
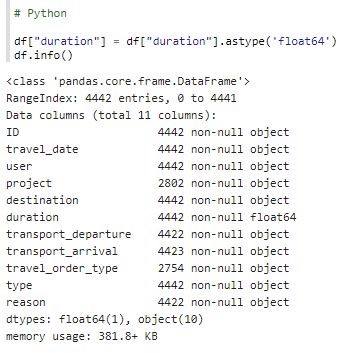
Examining the following result sets, we can easily see that the Travel Order dataset contains 4442 rows.
Python result set includes information about columns with null values. All columns are specified with object data type, which is also suspicious. The calculation of mean is specified in the Deequ code but has not been computed.
The dataset should be further investigated!
2. Prepare and clean data
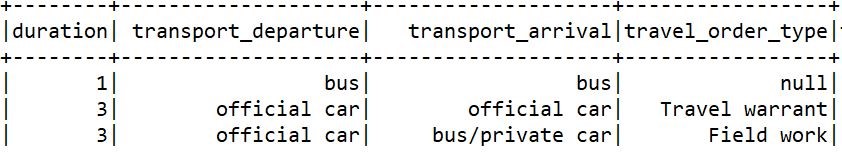
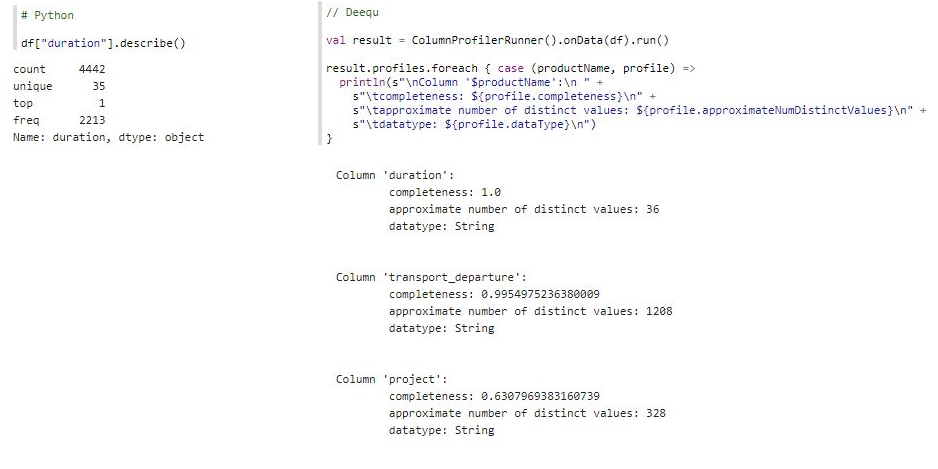
Column duration is treated as a String in the Python result, hence the calculation of unique values and their frequencies. It would be more useful to calculate min, max and mean values. Deequ detects column datatypes based on values and column duration is again detected as a String. Since duration contains number of days the employee spent on a business trip, the expected data type is Integral or Fractional.
This was a clue that data is dirty. We should inspect some values:
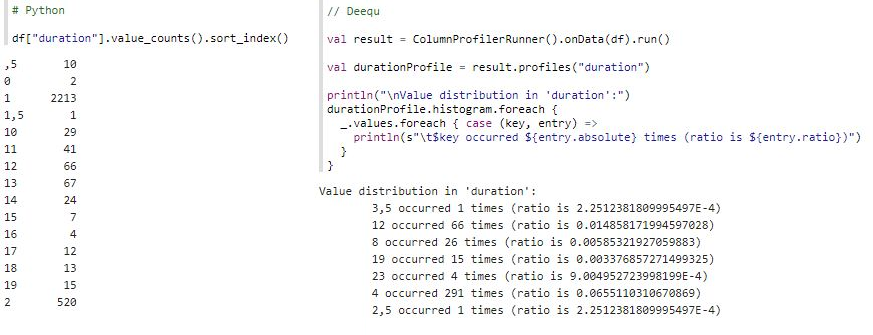
Immediately, values “,5” , “1,5”, “3,5”, “2,5” indicate that data contains dirt. Let’s clean it up a bit:
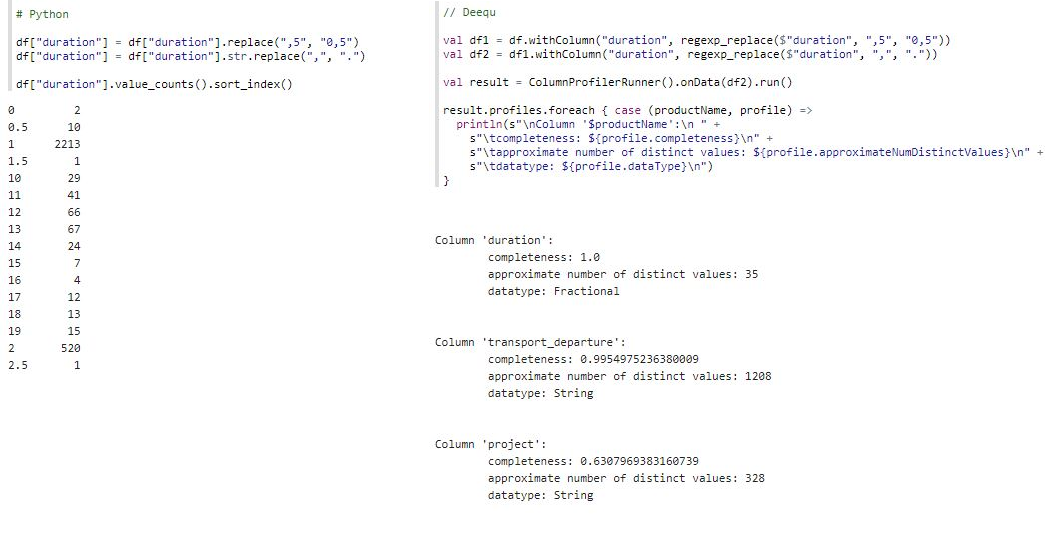
Better, but Python result set is not done yet because column duration is still treated as a String. In the Deequ result set, column duration is Fractional. Python needs a few more steps to finalize data cleaning.
Data Type of column duration is still an object. It needs to be cast to the right datatype:
With Deequ, data preparation was executed in fewer steps than Python. An extended profile is available for numeric columns with Deequ, which is shown in the next step.
3. Validate through statistics
Finally, we can confirm that we are interpreting data in column duration correctly. If the previous steps were enough, the following code should compute a meaningful data statistic. Otherwise, back to exploring and cleaning.
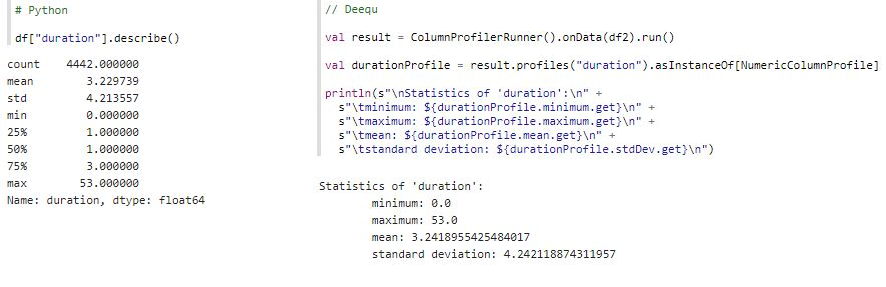
As shown, descriptive statistics were successfully calculated. Looking at max values is a great way of detecting outliers. The longest business trip lasted 53 days. Is that number low or high? Before we label the value as an anomaly and conclude that the mean is distorted, we should contact the person responsible for entering the data for clarification.
Now that we got a glimpse of an average business trip length, what is next?
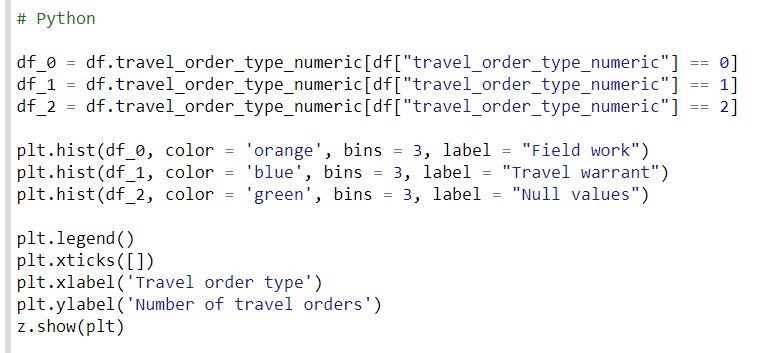
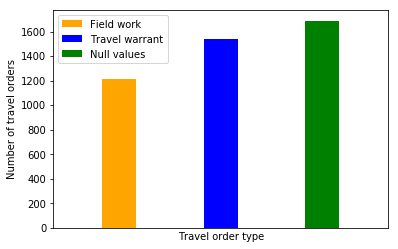
4. Visualize distributions of variables, one at a time
A histogram is a great way to get an idea about values in a column and how often they appear (i.e. distribution). Quantitative data is grouped in bins. For a clearer result set comparison, a column with fewer data points is better suited for visualization. Column travel_order_type has only three values:
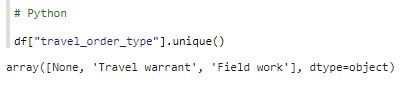
The values are categorical; they should be replaced with numeric values. NaN values are also replaced:
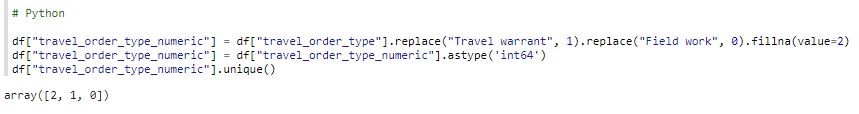
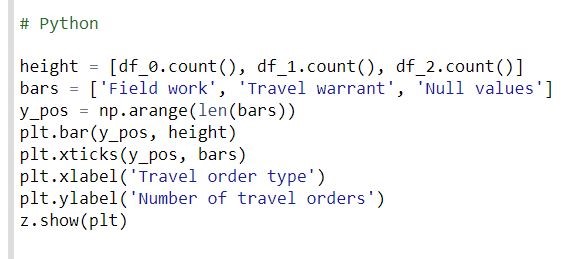
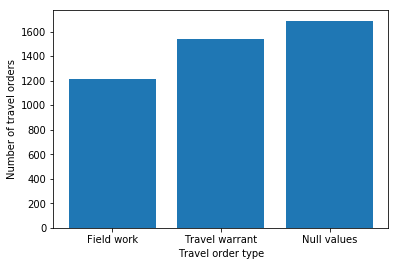
The following is another visualization with Python Matplotlib bar chart.
With Deequ, distribution is computed as shown:
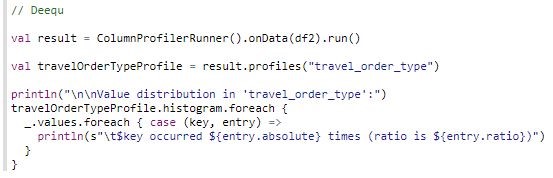
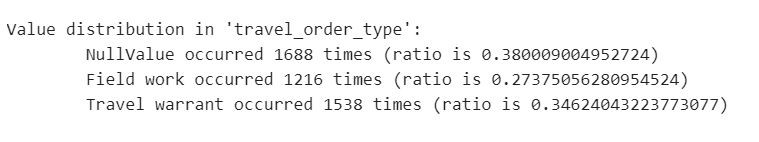
The distribution in column travel_order_type is easily compared between the Python visualizations and Deequ.
Deequ is a library for data quality assessment only and data visualization is unfortunately not available.
If you are interested in reading more about data visualization, you should read or check out our popular Data Visualization course.
Checking, checking, 1, 2, 3, …!
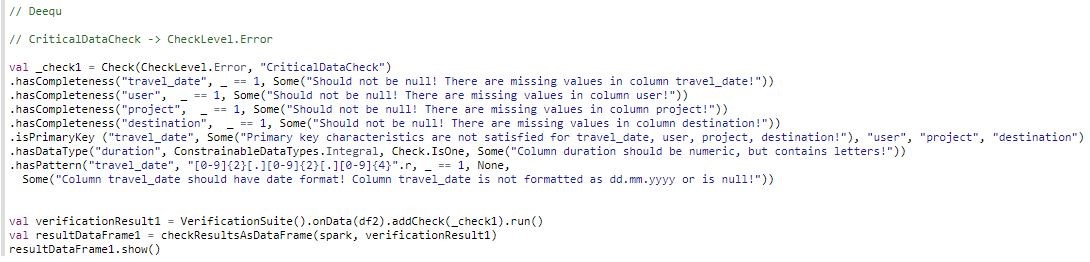
Now that we have a sense of the data we are dealing with, we can easily define Deequ Checks and assess data quality.
val _check = Check(CheckLevel.Error, “isComplete: Should not be null“).isComplete(“travel_date”)
val verificationResult = VerificationSuite().onData(df).addCheck(_check).run()
val resultDataFrame = checkResultsAsDataFrame(spark, verificationResult)
Check = group of constraints
Level = Error, Warning
Description = custom description of check block
Seq[Constraint] = constraints to apply when this check is run
After calling run, a Check is translated to a series of Spark jobs.
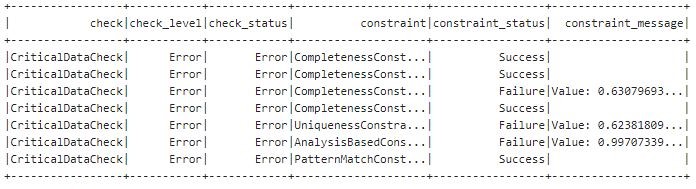
For a check to be considered successful, all data must meet the condition specified by the constraint or meet the minimum threshold, if this is a constraint condition.
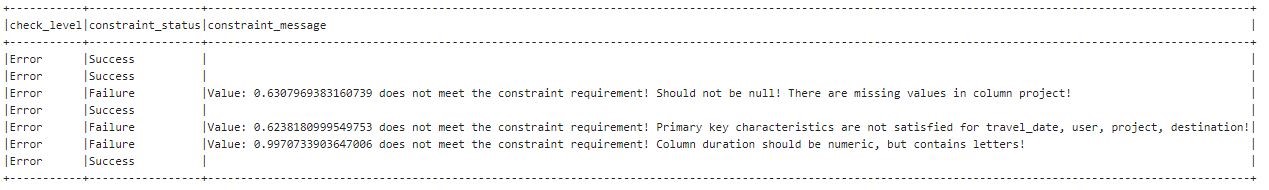
In the following example, Critical Data Check expects a user defined threshold of 100%. If the data is not compliant, the data quality status (check_level) is labeled with Error and the data processing workflow will abort.
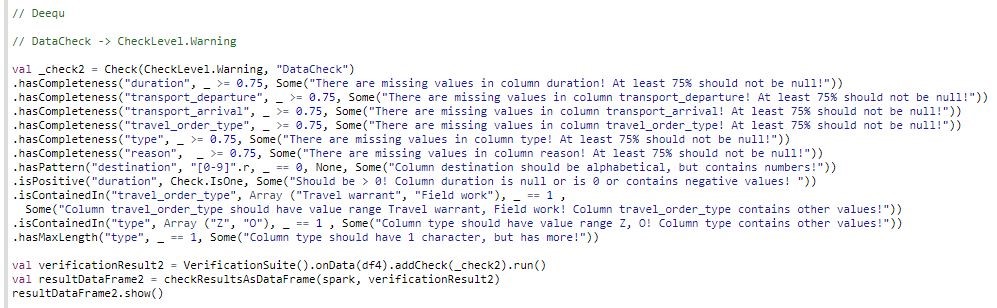
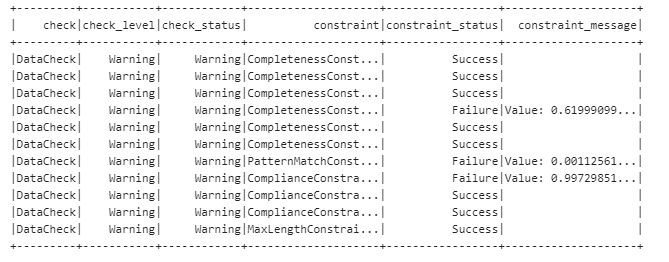
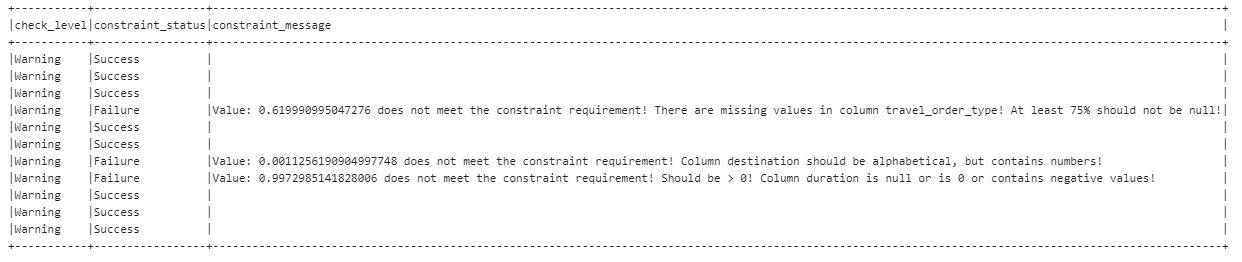
Non-critical Data Check expects a threshold of at least 75%. If there is non-compliant data, the data processing workflow will continue with a Warning.
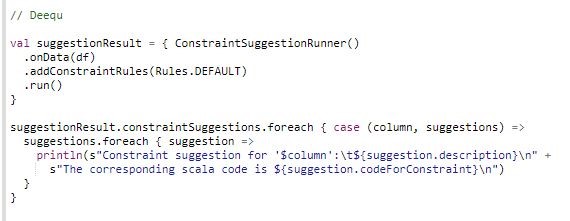
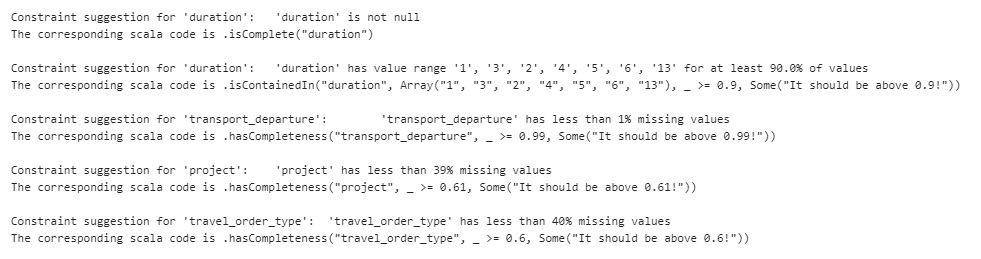
Deequ can even suggest constraints:
In conclusion, Deequ is a great tool for exploratory data analysis as well as for in depth data quality evaluation.
Here at CROZ Data Engineering Team, we are excited to use Deequ in our data processing pipeline and are looking forward to implementing more checks and testing other functions. We’ll keep an eye out for new developments and functionalities!
If you want to know more about this or related topics or you need some help with your data, feel free to get in touch with our data engineering team.
REFERENCES
- 1. BRITANNICA, Alison Eldridge, 5 Unbelievable Facts About Christopher Columbus, https://www.britannica.com/list/5-unbelievable-facts-about-christopher-columbus, 6.9.2020.
- 2. GARTNER, Smarter With Gartner, Susan Moore, How to Create a Business Case for Data Quality Improvement, https://www.gartner.com/smarterwithgartner/how-to-create-a-business-case-for-data-quality-improvement/, 6.9.2020.
- 3. WIKIPEDIA, Data verification, https://en.wikipedia.org/wiki/Data_verification, 6.9.2020.
- 4. GitHub, https://github.com/awslabs/deequ, 6.9.2020.
- 5. AWS Big Data Blog, Dustin Lange, Philipp Schmidt, Sebastian Schelter, and Tammo Rukat, Test data quality at scale with Deequ, https://aws.amazon.com/blogs/big-data/test-data-quality-at-scale-with-deequ/, 6.9.2020.
- 6. AMAZON SCIENCE, Sebastian Schelter, Felix Biessmann, Dustin Lange, Tammo Rukat, Philipp Schmidt, Stephan Seufert, Andrey Taptunov, Unit Testing Data with Deequ, https://www.amazon.science/publications/unit-testing-data-with-deequ, 6.9.2020.
- 7. GitHub, https://github.com/awslabs/deequ/tree/master/src/main/scala/com/amazon/deequ/examples, 6.9.2020.