

Introduction
DeepSeek V3 0324 is the latest state-of-the-art open-weight large language model from the Chinese DeepSeek frontier lab. It offers excellent performance for a variety of advanced AI applications. As organizations increasingly recognize the value and challenges associated with incorporating AI into their business processes, the importance of data privacy and intellectual property protection becomes significant. Leveraging on-premises deployment of open-weight large language models (LLMs) such as DeepSeek V3 0324 addresses these critical concerns by ensuring sensitive data remains securely within organizational infrastructure, eliminating exposure risks associated with cloud-based solutions.
However, serving large language models at scale introduces specific challenges, like infrastructure costs, resource optimization, and maintaining efficient inference speeds. See our previous blogs covering vLLM optimization.
In this blog, we explore these aspects by benchmarking DeepSeek V3 0324, served using the high-performance vLLM inference engine.
Benchmark Test Environment
Hardware:
We performed benchmark testing across two robust hardware environments.
- Single node with 8 GPUs NVIDIA A100 SXM4 80 GB
- Single node with 8 GPUs NVIDIA H100 SXM5 80 GB
Each server has a total of 640 GB of vRAM available. Since the model requires 720 GB and we need additional vRAM for KV cache during inference we need to use a quantized version of the DeepSeek V3 0324.
Model:
Specification of the DeepSeek V3 0324 model is given with the following parameters:
- Parameter number – 685B (671B + 14B MTP) parameters
- Model type – Mixture of Experts
- Number of routed experts per layer – 256
- Parameter precision – FP8 for training/BF16 for inference
- Number of layers – 61 transformer layers
- Hidden dimension – 7168
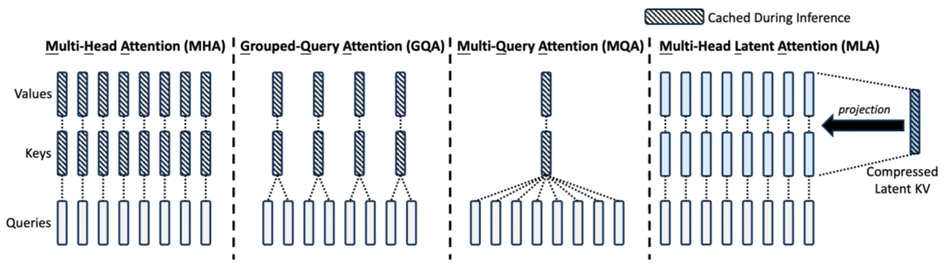
- Multi-head Latent Attention mechanism
- 128 Attention Heads
- Max context length 128K tokens
One of the most significant advantages of DeepSeek-V3-0324 is its Multi-head Latent Attention mechanism and its impact on inference speed. By compressing the KV caches and reducing the computational requirements, the model can process information much more quickly than comparable models with traditional attention mechanisms.
Since vLLM doesn’t support GGUF quantization we used Activation-aware Weight Quantization (AWQ). For the purpose of our test, we chose cognitivecomputations/DeepSeek-V3-0324-AWQ 4-bit quant which requires around 400GB of vRAM for its weights. That leaves us with 200GB of vRAM usable for KV cache at inference which should be enough.
https://huggingface.co/cognitivecomputations/DeepSeek-V3-0324-AWQ
Datasets:
For the testing purpose we used datasets that we constructed ourselves, and we made them publicly available on our HuggingFace profile page.
Benchmark tests were performed with benchmark_serving.py script that we refactored to support 2 additional parameters (min-tokens and max-tokens). Each test is performed locally on a node hosting the model.
vLLM runtime:
In our tests, we used vLLM v0.8.2. with V0 engine enabled and with the following same configuration for each test run:
    command:
      - "--model=cognitivecomputations/DeepSeek-V3-0324-AWQ"
      - "--trust-remote-code"
      - "--device=cuda"
      - "--disable-log-requests"
      - "--max-model-len=131072"
      - "--max-num-batched-tokens=98304"
      - "--max-seq-len-to-capture=98304"
      - "--gpu-memory-utilization=0.95"
      - "--tensor-parallel-size=8"
      - "--enable-chunked-prefill"
      - "--enable-prefix-caching"
    environment:
      VLLM_ALLOW_LONG_MAX_MODEL_LEN: 1
      VLLM_USE_V1: 0
      VLLM_WORKER_MULTIPROC_METHOD: spawn
      VLLM_MARLIN_USE_ATOMIC_ADD: 1
Benchmark Test Results
We performed 3 consecutive test runs on each of the two environments. During each test run, we wanted to compare the results of benchmark metrics on the identical test run between A100 and H100 environments. We focused on the following metrics:
- Output token throughput
- Time to First Token – TTFT
- Time per Output Token – TPOT
- Inter-token Latency – ITL
- End-to-end Latency – E2EL
We present results from benchmark testing for each test run separately.
The first test run was performed on a single sequence of length 10K tokens. In this test run, we investigate the performance of processing a single request to get insight into the maximal processing speed for a single end-user that we can achieve. The results for this first test run were as follows:
First test run results from A100 server
============ Serving Benchmark Result ============
Successful requests:                     1
Benchmark duration (s):                  26.12
Total input tokens:                      9685
Total generated tokens:                  581
Request throughput (req/s):              0.04
Output token throughput (tok/s):         22.24
Total Token throughput (tok/s):          393.04
---------------Time to First Token----------------
Mean TTFT (ms):                          729.64
Median TTFT (ms):                        729.64
P25 TTFT (ms):                           729.64
P75 TTFT (ms):                           729.64
P99 TTFT (ms):                           729.64
-----Time per Output Token (excl. 1st token)------
Mean TPOT (ms):                          43.77
Median TPOT (ms):                        43.77
P25 TPOT (ms):                           43.77
P75 TPOT (ms):                           43.77
P99 TPOT (ms):                           43.77
---------------Inter-token Latency----------------
Mean ITL (ms):                           43.77
Median ITL (ms):                         43.75
P25 ITL (ms):                            43.49
P75 ITL (ms):                            44.02
P99 ITL (ms):                            44.92
----------------End-to-end Latency----------------
Mean E2EL (ms):                          26118.39
Median E2EL (ms):                        26118.39
P25 E2EL (ms):                           26118.39
P75 E2EL (ms):                           26118.39
P99 E2EL (ms):                           26118.39
==================================================
First test run results from H100 server
============ Serving Benchmark Result ============
Successful requests:                     1
Benchmark duration (s):                  81.59
Total input tokens:                      9685
Total generated tokens:                  4537
Request throughput (req/s):              0.01
Output token throughput (tok/s):         55.60
Total Token throughput (tok/s):          174.30
---------------Time to First Token----------------
Mean TTFT (ms):                          163.34
Median TTFT (ms):                        163.34
P25 TTFT (ms):                           163.34
P75 TTFT (ms):                           163.34
P99 TTFT (ms):                           163.34
-----Time per Output Token (excl. 1st token)------
Mean TPOT (ms):                          17.95
Median TPOT (ms):                        17.95
P25 TPOT (ms):                           17.95
P75 TPOT (ms):                           17.95
P99 TPOT (ms):                           17.95
---------------Inter-token Latency----------------
Mean ITL (ms):                           17.95
Median ITL (ms):                         17.93
P25 ITL (ms):                            17.80
P75 ITL (ms):                            18.08
P99 ITL (ms):                            18.67
----------------End-to-end Latency----------------
Mean E2EL (ms):                          81593.32
Median E2EL (ms):                        81593.32
P25 E2EL (ms):                           81593.32
P75 E2EL (ms):                           81593.32
P99 E2EL (ms):                           81593.32
==================================================
The second test run was performed on a single sequence of prompt length of 16K tokens. In this test run, we inspect the effect of increasing prompt length and processing of longer sequences. The results for this second test run were as follows:
Second test run results from A100 server
============ Serving Benchmark Result ============
Successful requests:                     1
Benchmark duration (s):                  90.24
Total input tokens:                      15797
Total generated tokens:                  1626
Request throughput (req/s):              0.01
Output token throughput (tok/s):         18.02
Total Token throughput (tok/s):          193.07
---------------Time to First Token----------------
Mean TTFT (ms):                          317.15
Median TTFT (ms):                        317.15
P25 TTFT (ms):                           317.15
P75 TTFT (ms):                           317.15
P99 TTFT (ms):                           317.15
-----Time per Output Token (excl. 1st token)------
Mean TPOT (ms):                          55.34
Median TPOT (ms):                        55.34
P25 TPOT (ms):                           55.34
P75 TPOT (ms):                           55.34
P99 TPOT (ms):                           55.34
---------------Inter-token Latency----------------
Mean ITL (ms):                           55.34
Median ITL (ms):                         55.37
P25 ITL (ms):                            54.50
P75 ITL (ms):                            56.10
P99 ITL (ms):                            57.12
----------------End-to-end Latency----------------
Mean E2EL (ms):                          90240.43
Median E2EL (ms):                        90240.43
P25 E2EL (ms):                           90240.43
P75 E2EL (ms):                           90240.43
P99 E2EL (ms):                           90240.43
==================================================
Second test run results from H100 server
============ Serving Benchmark Result ============
Successful requests:                     1
Benchmark duration (s):                  19.82
Total input tokens:                      15797
Total generated tokens:                  1070
Request throughput (req/s):              0.05
Output token throughput (tok/s):         53.99
Total Token throughput (tok/s):          851.04
---------------Time to First Token----------------
Mean TTFT (ms):                          488.13
Median TTFT (ms):                        488.13
P25 TTFT (ms):                           488.13
P75 TTFT (ms):                           488.13
P99 TTFT (ms):                           488.13
-----Time per Output Token (excl. 1st token)------
Mean TPOT (ms):                          18.08
Median TPOT (ms):                        18.08
P25 TPOT (ms):                           18.08
P75 TPOT (ms):                           18.08
P99 TPOT (ms):                           18.08
---------------Inter-token Latency----------------
Mean ITL (ms):                           18.08
Median ITL (ms):                         18.06
P25 ITL (ms):                            17.94
P75 ITL (ms):                            18.20
P99 ITL (ms):                            18.98
----------------End-to-end Latency----------------
Mean E2EL (ms):                          19818.62
Median E2EL (ms):                        19818.62
P25 E2EL (ms):                           19818.62
P75 E2EL (ms):                           19818.62
P99 E2EL (ms):                           19818.62
==================================================
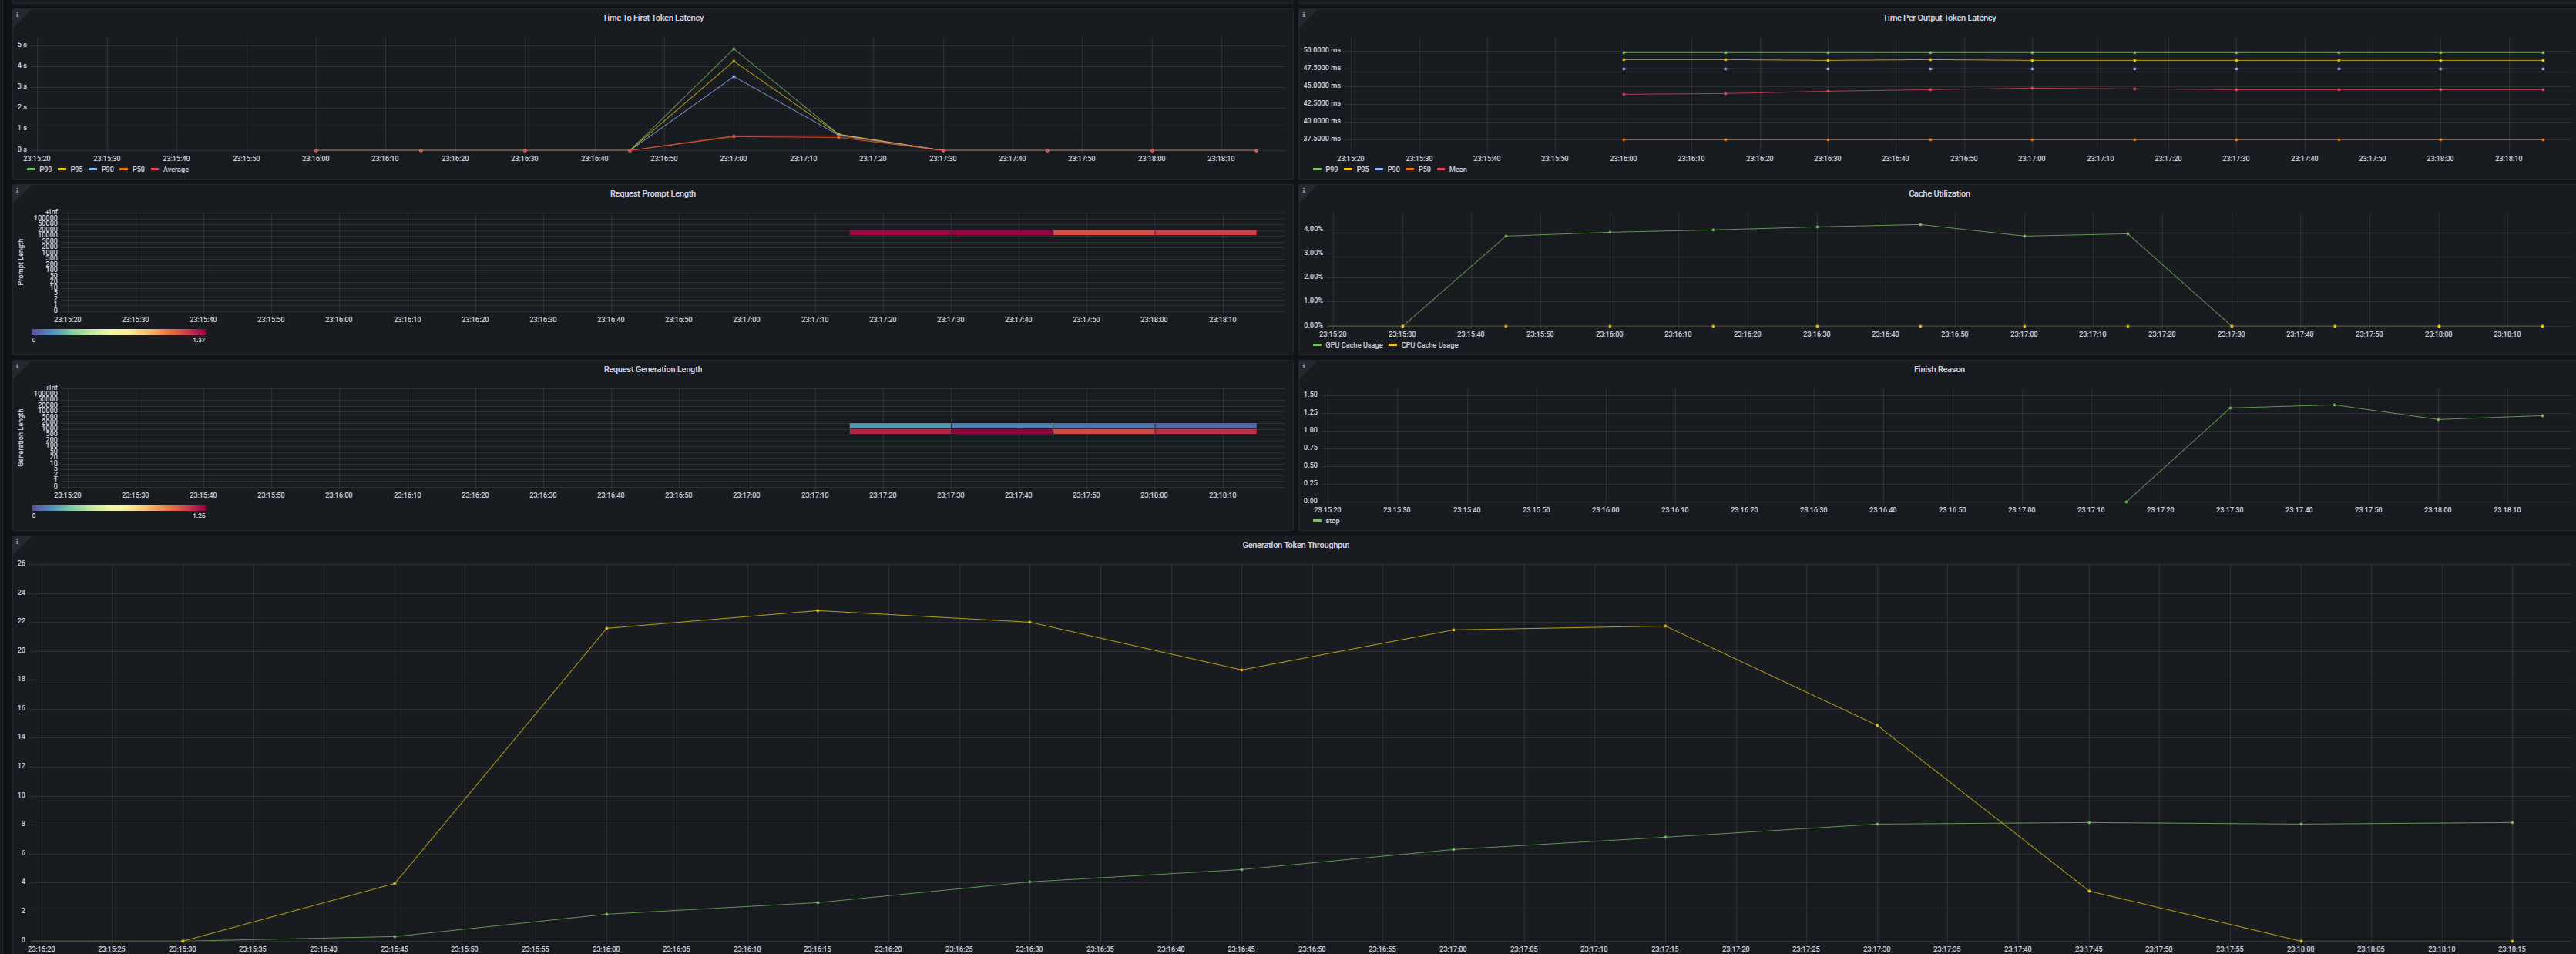
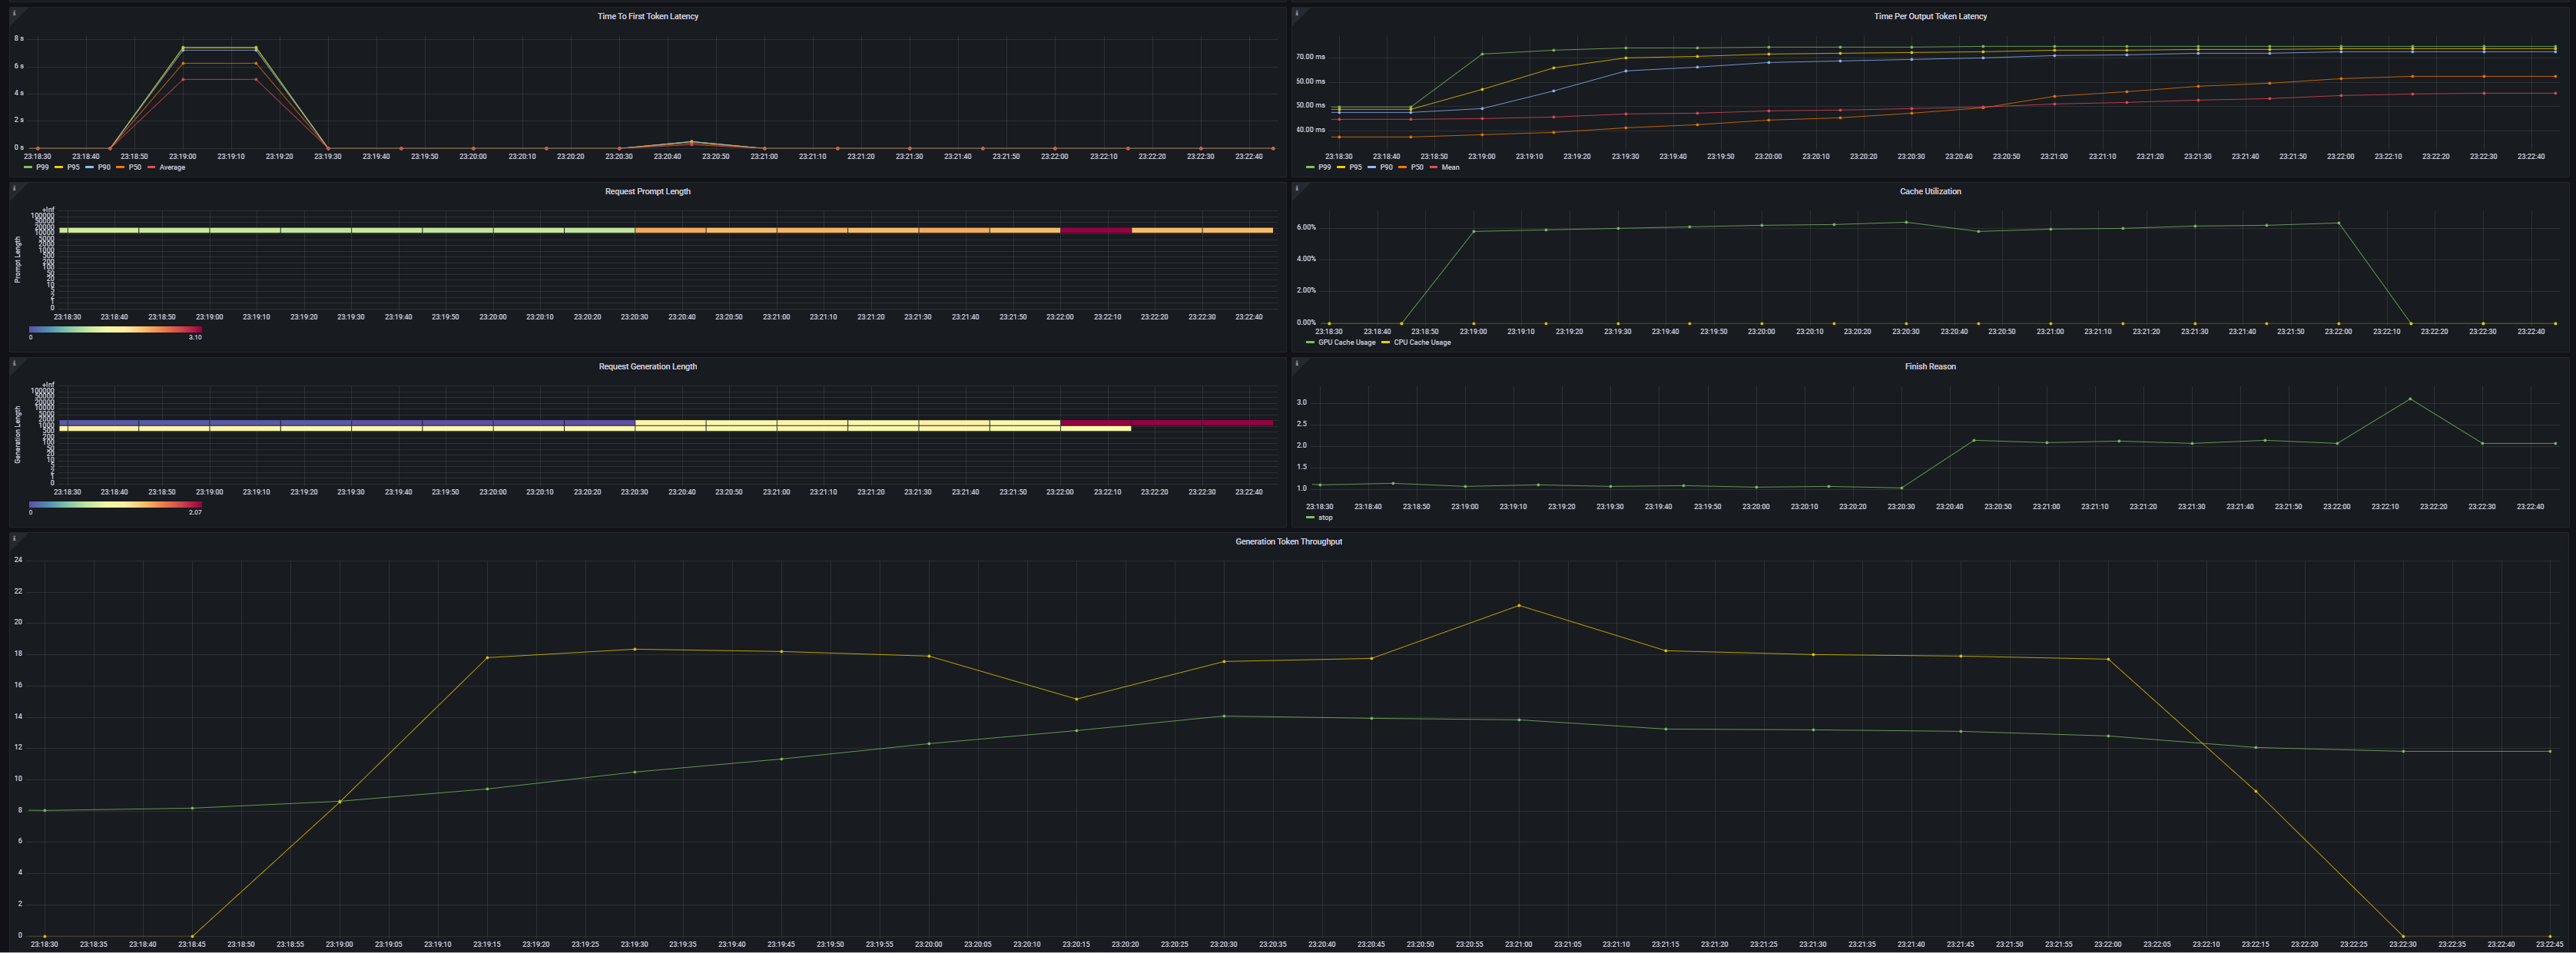
The third test run was performed on a sampled set of 200 sequences with lengths between 100 and 32K tokens. All tests were run with benchmark_serving.py set to –max-concurrency 100 –request-rate 100. This test simulates parallel load for 100 simultaneous requests of various sizes. The results were as follows:
Third test run results from A100 server
============ Serving Benchmark Result ============
Successful requests:                     200
Benchmark duration (s):                  1494.07
Total input tokens:                      576043
Total generated tokens:                  108266
Request throughput (req/s):              0.13
Output token throughput (tok/s):         72.46
Total Token throughput (tok/s):          458.02
---------------Time to First Token----------------
Mean TTFT (ms):                          59585.47
Median TTFT (ms):                        22737.77
P25 TTFT (ms):                           13965.46
P75 TTFT (ms):                           111578.45
P99 TTFT (ms):                           139355.89
-----Time per Output Token (excl. 1st token)------
Mean TPOT (ms):                          248.07
Median TPOT (ms):                        255.34
P25 TPOT (ms):                           217.32
P75 TPOT (ms):                           278.32
P99 TPOT (ms):                           349.85
---------------Inter-token Latency----------------
Mean ITL (ms):                           203.99
Median ITL (ms):                         176.31
P25 ITL (ms):                            121.70
P75 ITL (ms):                            207.29
P99 ITL (ms):                            818.12
----------------End-to-end Latency----------------
Mean E2EL (ms):                          169809.02
Median E2EL (ms):                        147559.75
P25 E2EL (ms):                           104987.26
P75 E2EL (ms):                           203047.06
P99 E2EL (ms):                           628710.78
==================================================
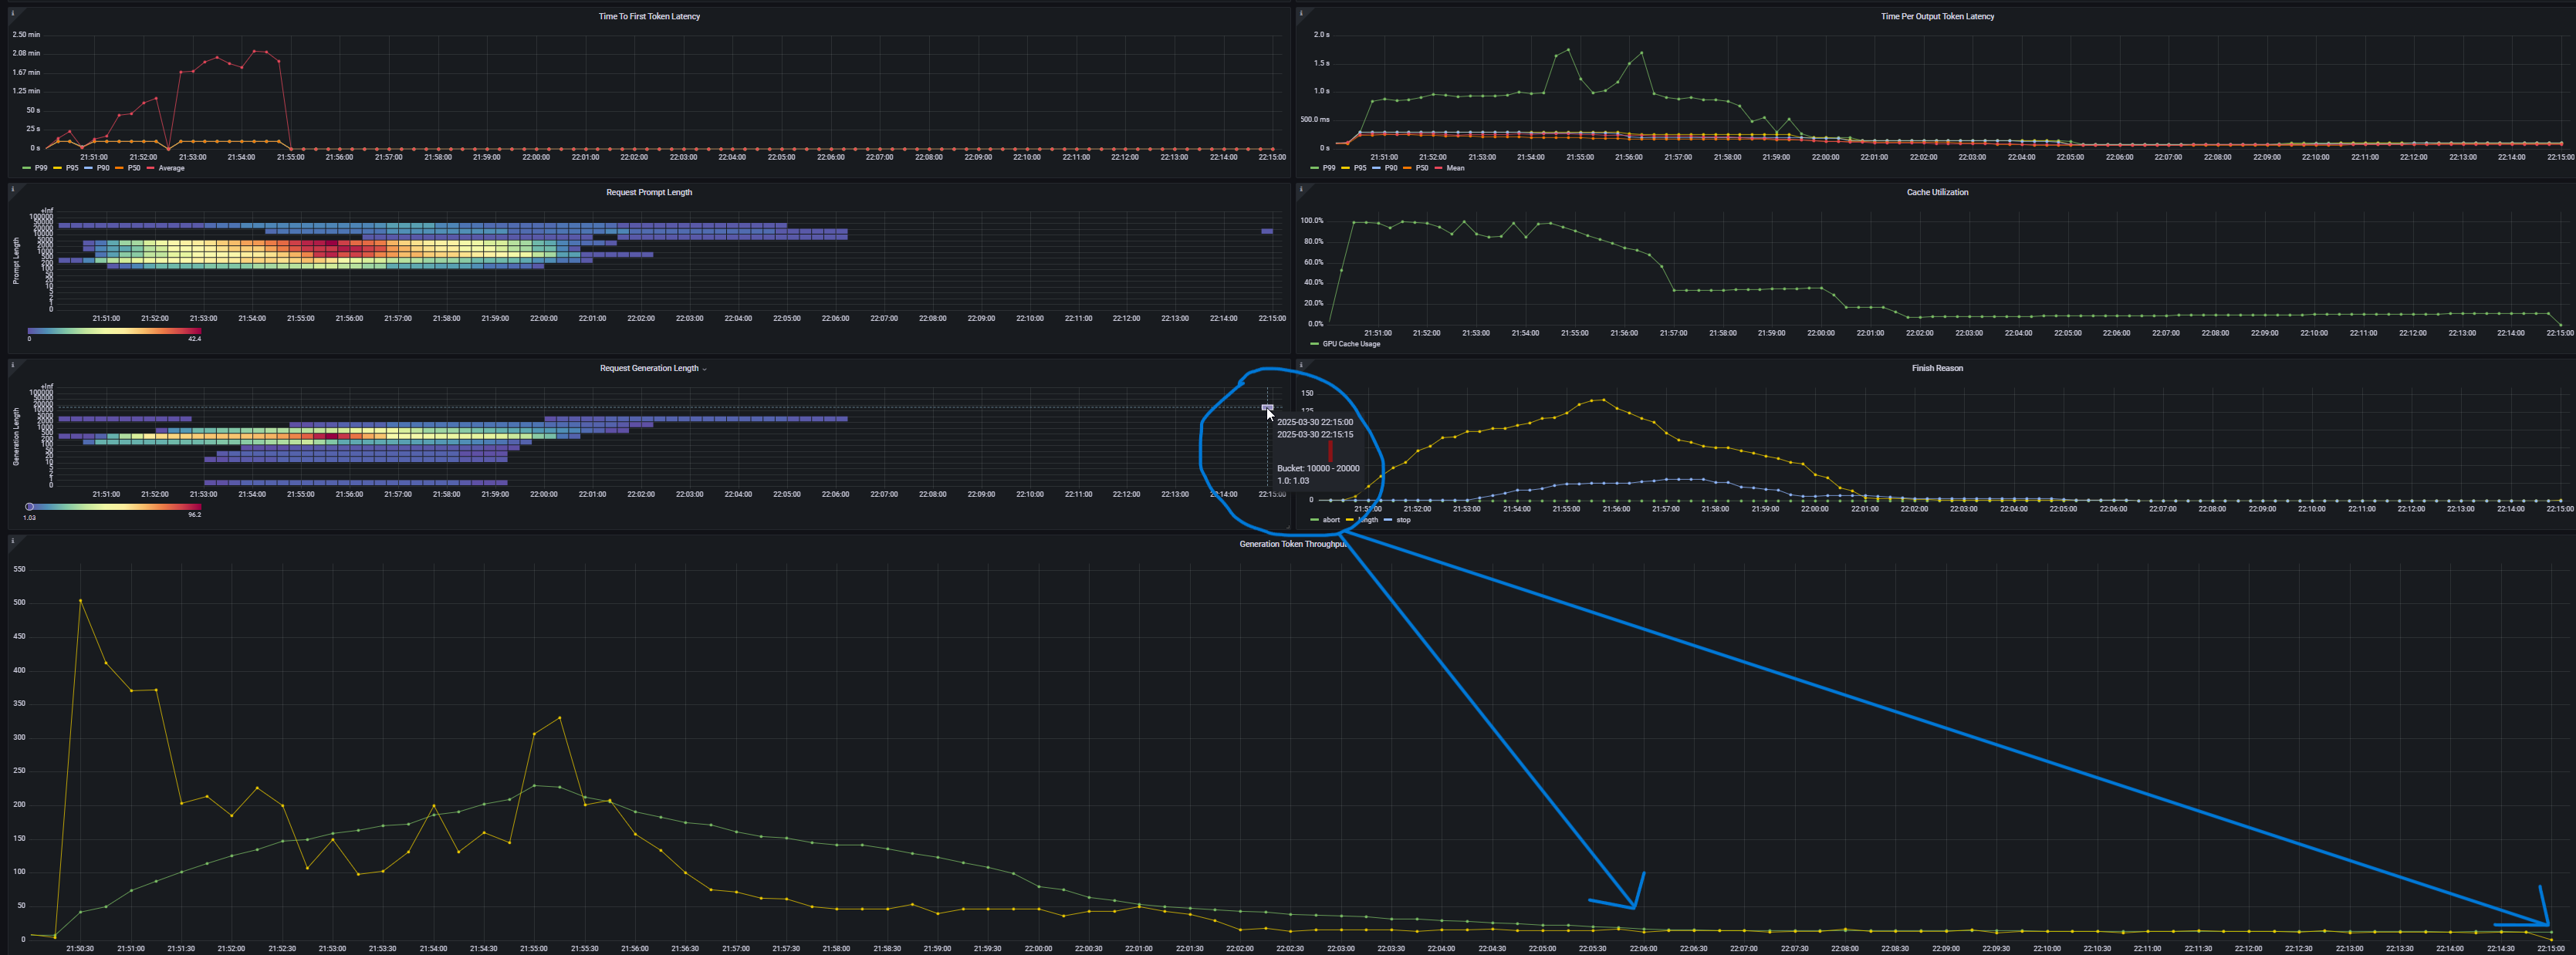
Third test run results from H100 server
============ Serving Benchmark Result ============
Successful requests:                     200
Benchmark duration (s):                  298.52
Total input tokens:                      576043
Total generated tokens:                  86354
Request throughput (req/s):              0.67
Output token throughput (tok/s):         289.27
Total Token throughput (tok/s):          2218.90
---------------Time to First Token----------------
Mean TTFT (ms):                          54414.41
Median TTFT (ms):                        53190.09
P25 TTFT (ms):                           25949.68
P75 TTFT (ms):                           77978.92
P99 TTFT (ms):                           105122.33
-----Time per Output Token (excl. 1st token)------
Mean TPOT (ms):                          90.91
Median TPOT (ms):                        89.30
P25 TPOT (ms):                           70.97
P75 TPOT (ms):                           107.45
P99 TPOT (ms):                           159.41
---------------Inter-token Latency----------------
Mean ITL (ms):                           81.76
Median ITL (ms):                         58.94
P25 ITL (ms):                            50.79
P75 ITL (ms):                            76.17
P99 ITL (ms):                            444.18
----------------End-to-end Latency----------------
Mean E2EL (ms):                          89635.43
Median E2EL (ms):                        90429.29
P25 E2EL (ms):                           62634.59
P75 E2EL (ms):                           110508.04
P99 E2EL (ms):                           227286.04
==================================================
Conclusion
In conclusion, the H100 server demonstrates significantly superior performance compared to the A100 for serving the DeepSeek-V3-0324 model. Across all test scenarios, and especially under demanding conditions (long sequence lengths at high concurrency), the H100 achieves much lower latencies and higher throughput than the A100. For example, mean inter-token latency (ITL) on H100 was only ~81.76 ms versus 203.99 ms on A100, a reduction of about 60% (with a similarly large drop in median ITL). The time per output token (TPOT) was likewise greatly improved: H100 averaged ~90.91 ms per token vs. 248.07 ms on A100 (roughly a 63% faster generation rate, also reflected in the median values).
The one area where H100 lagged slightly was time-to-first-token (TTFT): its mean TTFT was ~59.6 s, about a 9–10% increase over the A100’s ~54.4 s (likely due to initial overhead under heavy load), but this minor delay is vastly outweighed by H100’s superior steady-state performance.
The performance gap is mainly due to architectural differences: NVIDIA’s Hopper (H100) GPUs support advanced CUDA kernels like FlashMLA (a Flash Attention mechanism for Multi-Head Latent Attention) which is crucial for DeepSeek-V3-0324 since it uses Multi-Head Latent Attention mechanism in its design. On A100 GPUs vLLM can use TritonMLA only which shows limited performance during decoding compared to FlashMLA.
For the production usage and serving DeepSeek-V3-0324 at scale, we would therefore recommend an H100 GPU-based server with a minimum of 8 GPUs.
