If you’re interested in reading interviews with thought leaders and a digest of exciting ideas from the world of DevOps straight to your inbox, subscribe to our 0800-DEVOPS monthly newsletter!
In focus: Observability
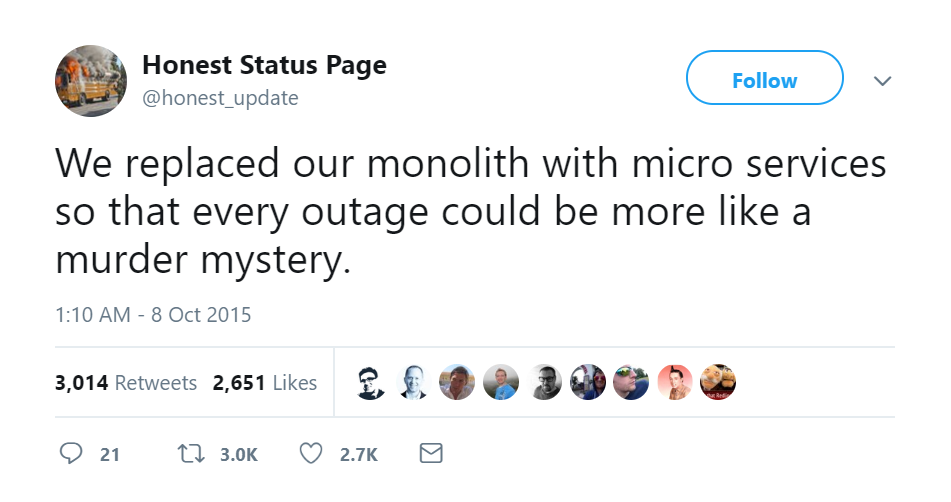
Although we are very much into distributed, scalable, microservice architectures, we must admit that good old monoliths do have some advantages. Troubleshooting is definitely simpler with monoliths because we’re looking at one set of logs and metrics. Just try troubleshooting a serious microservice system. Without proper data you’ll be lost correlating causes and effects.

The key to retaining full control over your system is observability which is just a fancy word for gaining better visibility into your system. When talking about observability we usually think of monitoring (getting metrics from the system to check its overall health), but that is rarely enough to solve a murder mystery.
We need more visibility through logging and tracing. Logging is creating timestamped records of discrete events that happened over time. Tracing is recording a series of causally related distributed events that describe end-to-end request flow through a distributed system.
In other words, monitoring reveals overall system health. Logging reveals insights from the perspective of one system component serving multiple requests. Tracing reveals insights from the perspective of one request flowing through multiple components. We need all three perspectives to reconstruct the full picture – observablity.
Riding with the King
No discussion on observability is complete without mentioning Prometheus, an open source monitoring tool ideal for cloud environments and microservice architecture. In this issue we’re talking with Julius Volz, co-founder of Prometheus project. We met at GOTO conference in Amsterdam this June. Julius is a great guy with a great story on how Prometheus came to life. Here is part of our conversation and if this make you feel like joining Prometheus project, Julius won’t mind.
–“Riding with the Queen/King” is our series featuring short interviews with super interesting people from the field of technology.
Worth of your time
+ Priyanka Sharma, Director of Technical Evangelism at GitLab, gave an excellent overview of observability using Prometheus, Jaeger, and Istio last year on “All Day DevOps” conference.
+ You can never be to young to start with Kubernetes! Give your kids a head start in life with Illustrated Children’s Guide to Kubernetes.
Read with us
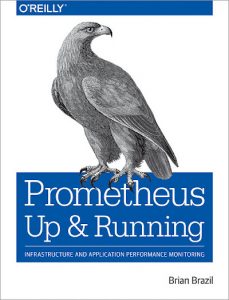
Prometheus: Up & Running
Hands-on introduction to Prometheus covering all major aspects of this great tool including metric collection, dashboarding with Grafana and alerting.
We especially liked tips and tricks on running, growing and sharding your Prometheus system.
Quote of the Day

“Ask a programmer to review ten lines of code, he’ll find ten issues. Ask him to do five hundred lines, and he’ll say it looks good.“
— Gene Kim, The DevOps Handbook: How to Create World-Class Agility, Reliability, and Security in Technology Organizations


