You might have heard about Panama Papers. If not, they are 11.5 million leaked documents that detail financial and attorney-client information for more than 200.000 offshore entities. Some of those entities were shell corporations that were used for illegal purposes, to keep personal financial information of wealthy individuals, including public officials, private.
The documents were leaked to German newspaper Der Spiegel which then shared them with more than 400 colleagues in 80 countries to be able to analyze and digest them more efficiently. Enter graph databases!
Graph databases were used to analyze the data and find relationships between those people and entities. The people exploring the data were reporters and journalists with little to none technical education and since they’ve managed to reveal a lot and connect many dots – it’s obvious graph databases are very intuitive and easy to use.
(If you want to explore Panama Papers on your own, you can try graph databases for yourself.)
We at CROZ first got introduced to graph databases a few years ago (you can read more how we used graph databases here) and we’ve been working with them since then in one aspect or another – either as a standalone product used for data exploration or as a part of a bigger system for storing data as an intermediary.
The neat thing about graph databases is that they are graphs, and there are a lot of graph algorithms that can be used to find a solution to your problem. That is why they started getting more traction lately and why I decided to look deeper into the matter.

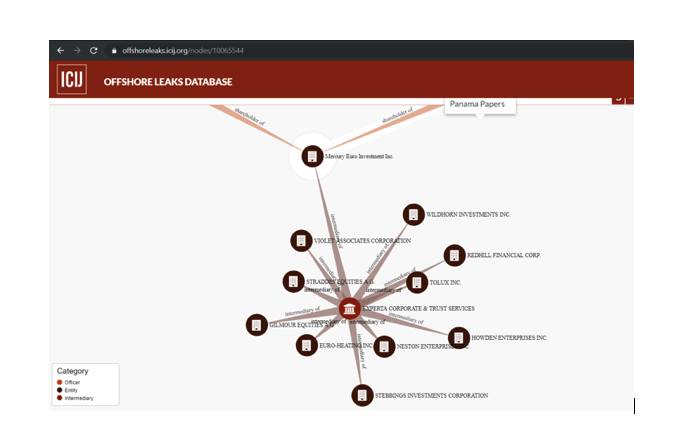
An example of Panama Papers data
Graph databases have been in development for the past 20 years or so (with their roots set in 1960s), but they haven’t caught on until now (except for a few specific use cases which will I will mention later). To understand the concept of graph databases it is important to understand what a graph is and what is a database.
What is a database?
In layman’s terms a database is an organized collection of data or a place to store your data for somewhat easy access. Data is stored in tables and tables can reference each other. When you want to combine data from different tables you must use joins, which are costly. When you want to see a connection from point A to point B in a relational database it could take time for you to write the query and time for the engine to execute it.
This is where graph databases get their moment to shine. It is also essential to know your data, which can be achieved by exploring it. Data exploration is done much more straightforward in graph databases than in relational databases because it is a simple matter of following connections once you have a starting point, while in relational databases it is necessary to write queries to examine your data. Now that we defined a database, we should also establish graphing.
What is a graph?
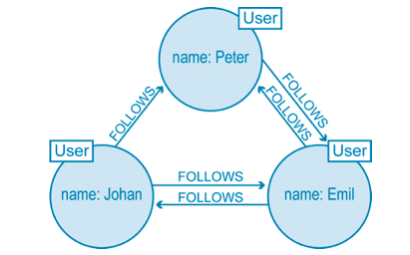
Without going into mathematical definitions and formulas, a graph is a representation of objects (nodes, entities) and their relationships (edges). Nodes represent entities (e.g. people and businesses, and they can be loosely thought of as an equivalent of a row in a relational database. Edges are the lines that connect nodes to other nodes. Edges can be directed (that means that an edge describes a one-way relationship) or undirected (describes a two-way relationship). In graph databases there are also properties, properties are additional information about nodes and edges (key-value pairs).

Example of a graph
Graph databases are a combination of the two mentioned concepts. They are intended to hold data without constricting it to a pre-defined model. Graph databases excel at managing highly connected data and complex queries, which gives them an edge over traditional relational databases.
Something that could have been achieved with a very complex combination of joins in relational database can be done a lot simpler using graph databases (e.g. finding all the partners of a person running a business that supplies fresh fruit to your kitchen would require some work in relational databases, while in a graph database it is a simple manner of displaying all nodes connected to the person running a delivery business).
Why are graph databases becoming popular just now?
With everything we covered up until now, you are probably wondering why graph databases have not been more popular. Well, they still haven’t reached their full potential and are mostly used in some particular use cases. Typical use cases include fraud detection (anti-money laundering, e-commerce fraud, insurance fraud), recommendation engine, network monitoring, identity, access management and many others.
There are currently only a few graph database vendors (Neo4j, JanusGraph, Amazon Neptune, ArangoDB), but probably the one that stands out the most is Neo4j. It has a massive community, and the language used is Cypher, which is considered easy to learn. The size of its community currently gives them an edge over their competition.
If you want to learn more about graph databases or use them in one of your projects, feel free to contact our data engineering team.
