We’ve interviewed Julius Volz for our 0800-DEVOPS newsletter.
If you’re interested in reading interviews with thought leaders and a digest of exciting ideas from the world of DevOps straight to your inbox, subscribe to our 0800-DEVOPS monthly newsletter!
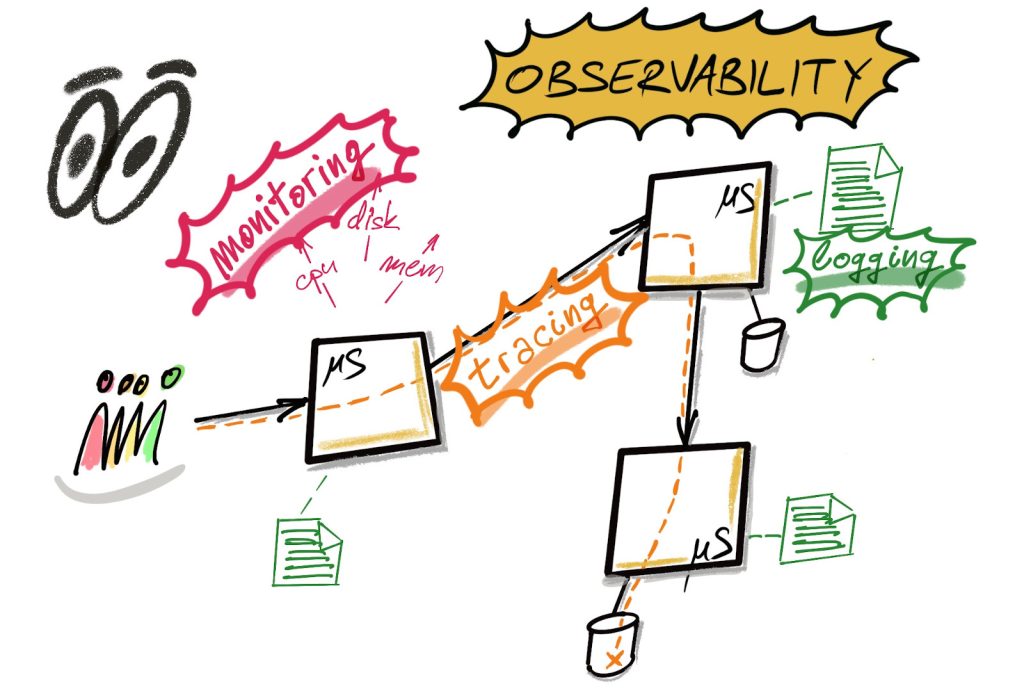
No discussion on observability is complete without mentioning Prometheus, an open source monitoring tool ideal for cloud environments and microservice architecture. One of the figures behind this project is Julius Volz, co-founder of Prometheus. We met at GOTO conference in Amsterdam this June where he gave an introductory talk to Prometheus. Julius is a great guy with a great story on how Prometheus came to life. Here is part of our conversation and if this make you feel like joining Prometheus project, I’m sure Julius won’t mind
Ivan: If you had 30 seconds, how would you describe what Prometheus is?
Julius: Prometheus is an open-source monitoring system and time series database. It features a multi-dimensional data model with a powerful query language and integrates many aspects of systems and service monitoring: from the instrumentation of services over the collection and storage of metrics data, all the way to dashboarding and alerting. Native support for various service discovery mechanisms also make it particularly suitable for dynamic cloud-based environments.
Ivan: Prometheus is without doubt great piece of software. How did you come up with the idea to build it? Did you build it alone?
Julius: In 2012, I left my job as a Site Reliability Engineer at Google to join SoundCloud in Berlin. At the same time, another ex-Googler (Matt T. Proud) had just also joined SoundCloud, and we were both tasked with making SoundCloud faster and more reliable.
In a way, SoundCloud was ahead of its time since they had already built their own container-based cluster manager, in a time before Docker or Kubernetes existed. It ran hundreds of microservices with thousands of instances in a dynamically scheduled way. But existing open-source tools were not suitable for monitoring such a dynamic environment. We found them lacking in almost all aspects: weak data models, lack of complex querying capabilities, no integration of alerting and time series collection, bad UIs (Grafana also didn’t exist yet!), lack of efficiency, and maybe most importantly of all, no dynamic service discovery integration to tell the monitoring system what *should* be there at any time. Most systems were also clunky to operate, doubly so in a time before Docker.
So in the end, we decided to build our own monitoring system from scratch. This was in large parts inspired by Google’s Borgmon monitoring system, which was used to monitor services on Google’s Borg container-based cluster manager. We started building Prometheus in our free time, but introduced it to SoundCloud after a couple of months, after which we started spending proper work time on it.
Ivan: Why should an organization use Prometheus and what are the arguments for choosing it over other similar solutions?
Julius: Prometheus marries together several great selling points for a metrics-based monitoring system:
- It has a flexible label-based, dimensional data model.
- It has a powerful query language that allows efficient slicing and dicing of time series data.
- It’s efficient and relatively simple to operate (at least to begin with, since it’s not clustered).
- It works especially well for monitoring dynamic environments like Kubernetes, since it integrates with different kinds of service discovery.
- It integrates alerting with time series collection and the query language in a unified way.
- It’s 100% open-source and free software and not controlled by any single company.
On top of that (and because of that), Prometheus has become a de-facto standard for open-source monitoring in environments like Kubernetes. This means that there’s a huge community and hundreds of integrations.
Prometheus only processes metrics though. For logs, traces, and other observability signals, you still want to use other tools in addition.
Ivan: Are there any new functionalities that you’re working on? In which direction would you like Prometheus to continue developing?
Julius: You can take a look at Prometheus’s roadmap. Prometheus itself is relatively stable by now, and we don’t intend to increase its scope much (one major success factor of Prometheus is its simplicity and focus).
I think the most interesting Prometheus-related work these days is happening in integrations all around Prometheus. One example of this is Thanos, which provides durable long-term storage. There is still a lot of optimization work going on in terms of how such external storage systems interface with Prometheus.
Ivan: Can other people join Prometheus project and contribute?
Julius: Definitely! Have a look at our Community page, which also contains a Contributing section.
You might also be interested in joining the next Prometheus conference, PromCon EU 2019.
Ivan: What keeps you busy these days? What are you working on?
Julius: Since Prometheus is 100% free software and has no company or direct business model behind it, I’m earning my money and spending most of my time as a freelance consultant. I’m offering consulting, training, and custom software development all around Prometheus, and love helping companies get started on the right foot with the system.
Julius, thanks for sharing this story and hope to see you soon!
If you’re interested in reading interviews with thought leaders and a digest of exciting ideas from the world of DevOps straight to your inbox, subscribe to our 0800-DEVOPS monthly newsletter!