A study from 2017 showed that 90% of all data ever created was created in 2016 and 2017. It’s estimated that by 2025 a staggering 460 exabytes (one exabyte is a million terabytes) of data will be created each day globally. Around 0.5% of data collected is used and analyzed.
Storytelling is an art as old as time. People have been telling stories for as long as we as a species can remember, from cave paintings to fairy tales to theatre plays to village or town traditions, all examples of storytelling that have survived for ages. In today’s world of information, we have a chance to tell stories based on the data we gather and analyze each and every day.
Most people might think that storytelling and visualization are different things, but they are actually highly connected. Unfortunately, sometimes end users can’t understand the data presented to them because they don’t work with that data on a daily basis or they might not have the necessary background to understand the data. This is where storytelling comes in.
With it you can explain to end users what is it that they are looking at. Storytelling allows the visualizations expert and domain user to explain the data shown in a visualization in order to familiarize the end user with it. The process starts by gathering data, exploring the data, storing the data, visualizing the data, and last but not least, explaining the data using a simplified and business oriented narrative combined with the aforementioned visualization of the data.
From that, we can determine the three most basic keys for data storytelling:
1. DATA
You need to have a good foundation to stand on, so you need clean and usable data. The data is ingested into a DWH and scrubbed clean.
2. VISUALIZATION
Then you need to visualize that data in such a way that it is not cluttered on a single page, that it is representable of the subject matter and that it shows the data that is needed (for more information read How to Understand All The Data: Visualize It).
3. NARRATIVE
The third key would be to talk to the end users and explain to them what the data shows and what does each one of your dashboards, reports, graphs represent so that they can use them as they were intended to be used. It is important to differentiate business users from end users. Business users are usually very well acquainted with the business rules and how the data is stored and what kind of data is stored. They are your best friends when creating a new data warehouse or data mart.
End users usually want to see the sum of the data or are interested in the bigger picture. End users are usually the ones who can make or break a BI model. Especially if they don’t know what are they looking at. That’s why explaining to them what data is presented and how is of great importance.
To get the most insight out of your data (and the effort you invested) you should hit that sweet spot where all of the mentioned keys intersect.
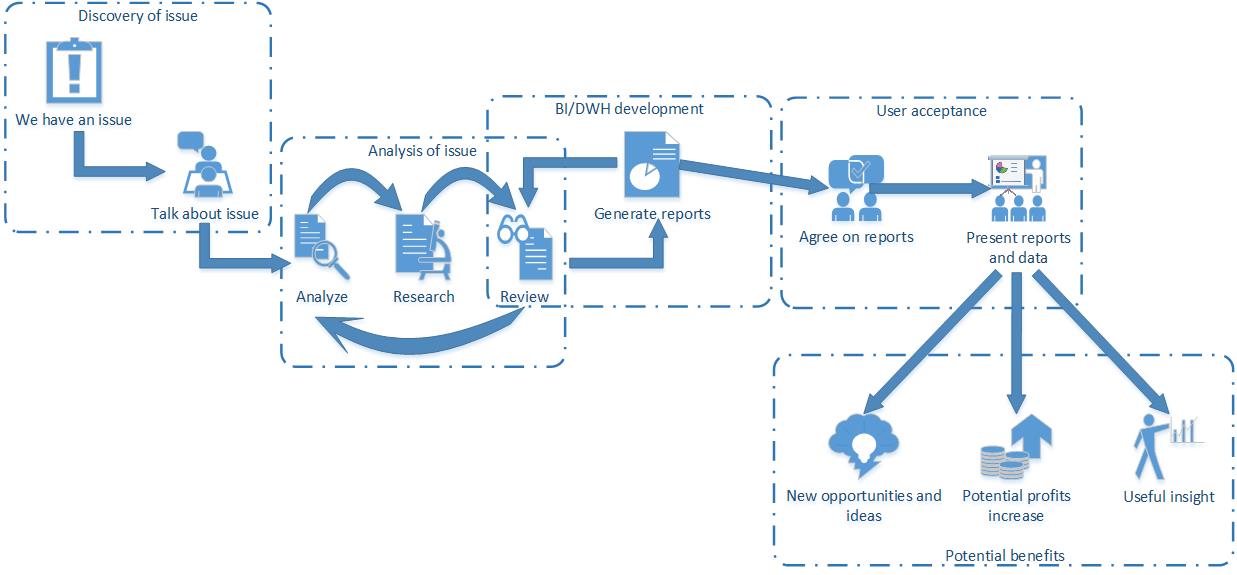
Data storytelling process and benefits
In my opinion the third step, the step where you can show (explain) to end users what kind of data you are presenting, is often the one that is the most critical. This is where things like Cognos Stories, PowerPoint presentation or just a simple drawing on a whiteboard can go a mile and really make a difference. For example, with Cognos Stories you can create a simple and chronological representation of the data available to effectively explain to end users what kind of data they are getting through different dashboards and/or reports.
While you are telling a story using the methods above it is a good idea to have a business user accompany you for detailed explanations and deeper meaning of the data presented. With the help of a business user/owner and the expertly made visualizations, dashboards and reports you or your team created there is nothing from stopping you from getting the most out of your data.
If you ever feel that you don’t know where your data story is going, call us. Lear more about our Data Engineering Services or just contact us. We can help you with your happily ever after concerning data.
Photo by Luke Chesser on Unsplash