When comparing Power BI vs Cognos, organizations often struggle to decide between modern self-service analytics and enterprise-grade reporting. Choosing the right visualization tool for your organization will have a signifcant impact on the way your team presents data. The right ecosystem can enable creation of complex data stories, analyses and explorations. But how do you know you chose the right tool for the job?
The perfect platform does not exist – it will always depend the client’s needs and wishes. In a world overflowing with data solutions, Microsoft Power BI and IBM Cognos Analytics stand out as two powerful tools for turning raw numbers into actionable narratives. Cognos Analytics excels in creating complex (pixel-perfect) reports, while Power BI emphasizes interactive visualizations. Microsoft and IBM improved their software over the years, as evident in their reputation and high reviews from trusted sources like Gartner.
In the past, we have developed projects and implemented ecosystems using both tools. At CROZ, we have decided to delve into the technicalities to provide an in-depth comparison of the features, capabilities, and limitations of both tools.
The scope of the comparison will include setup, semantic modelling, report development, user management and security, and deployment of reports. The goal here is to compare the two BI solutions fairly and on the same set of requirements.
Power BI vs Cognos: Feature Comparison Table
Before diving deeper into architecture, semantic modeling, and security, it is useful to compare Power BI vs Cognos at a high level. While both platforms are powerful business intelligence solutions, they are built with different priorities in mind. Power BI focuses on self-service analytics and interactive dashboards, while Cognos emphasizes enterprise governance and pixel-perfect reporting.
The table below highlights the key differences between Power BI vs Cognos across usability, reporting capabilities, scalability, governance, and deployment flexibility.
| Feature | Microsoft Power BI | IBM Cognos Analytics |
|---|---|---|
| Primary Use Cases | Self-service analytics and interactive dashboards | Governed enterprise reporting, structured analytics |
| Deployment Options | Cloud-first, on-premises with PBI Report Server | Cloud, on-premises, and hybrid deployment |
| Ease of Adoption | Designed for accessibility across a range of users; learning requirements vary by role | May require more formal training for advanced modeling and administration |
| Reporting Approach | Emphasis on interactive, exploratory visualizations | Emphasis on formatted, production-grade and pixel-precise reporting |
| Semantic Modeling | Integrated into Power BI Desktop | Centralized in Framework Manager |
| Governance | Supports governance through Microsoft tools | Strong centralized governance model with built-in controls for data access, metadata, and reporting standards |
| Custom Visualizations | Supports custom visuals and themes | Supports custom visuals and themes |
| Scheduling & Bursting | Supports subscriptions | Native scheduling, bursting, and report distribution capabilities |
| Security Features | Role-level security, integration with Azure Active Directory | Row-, column-, and object-level access controls within platform |
| Typical Organizational Fit | Often used for decentralized or business-led analytics | Often used in large organizations requiring centralized reporting and regulatory alignment |
| Ecosystem Integration | Integration with Microsoft ecosystem | Integration with IBM data and analytics ecosystem |
| Paginated Reporting | Supported via Power BI Report Builder | Natively supported |
| Pricing Approach | Subscription-based pricing with per-user and capacity options | Enterprise-oriented licensing, typically aligned with deployment scale and feature requirements |
This high-level comparison demonstrates that the choice between Power BI vs Cognos largely depends on organizational priorities. Companies looking for agile dashboard development and cloud-native analytics often lean toward Power BI, while organizations requiring advanced governance, enterprise reporting, and highly formatted outputs may find IBM Cognos Analytics to be the better fit.
Power BI vs Cognos: Architectural Overview
From an infrastructure perspective, the differences between Power BI vs Cognos become even more visible when organizations evaluate governance and semantic modelling capabilities.
IBM Cognos
Scalability and availability are at the core of Cognos’ architecture. It enables operability by using platform-independent, reliable technologies such as XML, SOAP, and WSDL.
Cognos follows an architecture consisting of three tiers:
- Web Server tier – includes gateways to handle requests between the client and application tier.
- Application tier – hosts the IBM Cognos BI server that handles all report processing, logic, and analytical computations.
- Data tier – connects the application tier to data sources and content storage. Content Store is a database that contains all Cognos configuration, report definitions, and metadata.
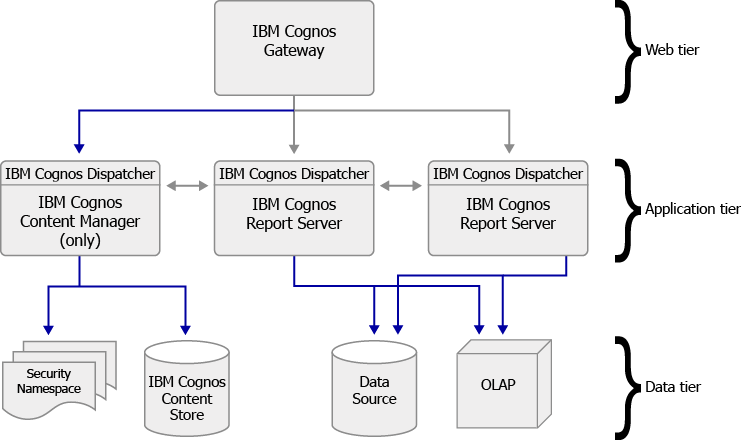
The Cognos ecosystem consists of the web-based Cognos Analytics for report development and the Cognos Framework Manager. Framework Manager acts as a middleman between data sources and Cognos Analytics. Governance is strongly enforced throughout the entire architecture. Furthermore, IBM Cognos solutions are also available in the cloud, providing all of the same tools and functionalities.
MS Power BI
Power BI has a SaaS-based architecture built on Microsoft Azure. This is ideal for scalability and rapid development. It is cloud-based and service-oriented.
Similarly, we can decompose the structure of Power BI into three layers:
- Client layer – consists of reporting tools for report development and consumption.
- Application layer – functions as the application layer and handles dataset storage, semantic model management, rendering, and access control enforcement.
- Data layer – connects to various data sources through multiple connectivity modes.
Development in Power BI is confined to the Power BI Desktop and focused on reporting. Unlike Cognos, it does not separate modelling and reporting. Governance is more strongly dependent on organizational standards and good practices than architecture.
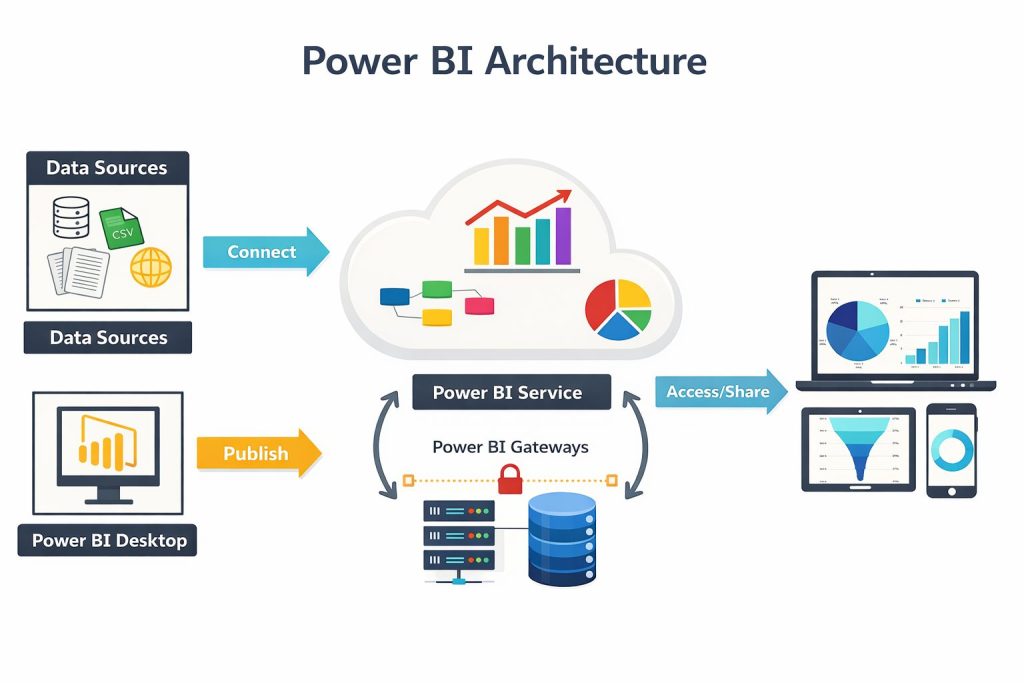
Additionally, Power BI is also available on-premise through Power BI Report Server offering most of the core functionalities available in Power BI Service/Power BI Desktop.
Semantic modelling
IBM Cognos
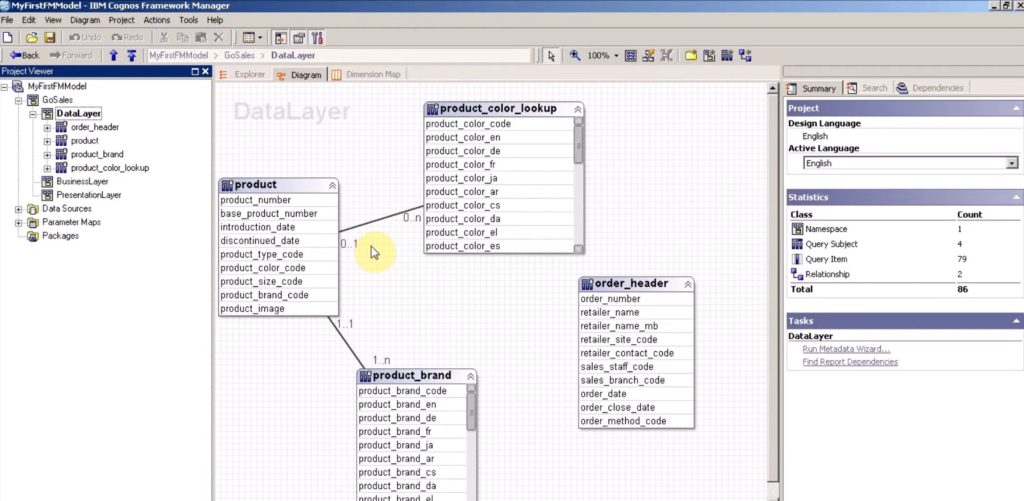
Cognos Framework Manager is an enterprise-grade modelling tool that provides strong governance, structure, and support for advanced modelling practices. In it, you load, transform, and apply rules to your data.
One common approach is to follow a three-layer architecture:
- Database layer- Represents the physical database structure imported from the source system. Relationships between data objects are also defined on this layer.
- Business layer – Applies business logic, calculations, and security rules. Raw data is transformed into meaningful, business-readable objects.
- Presentation layer – Organizes and simplifies model objects for report authors, exposing only the elements relevant for reporting.
The use of a three-layer structure serves to shield end users from changes in the database affecting their experience. It provides a reliable, predictable base for report development. Once the model is finalized, it is published as a package. A package is a curated subset of the full model, for a specific use case or business domain. Packages are then made available in Cognos Analytics for report development.
MS Power BI
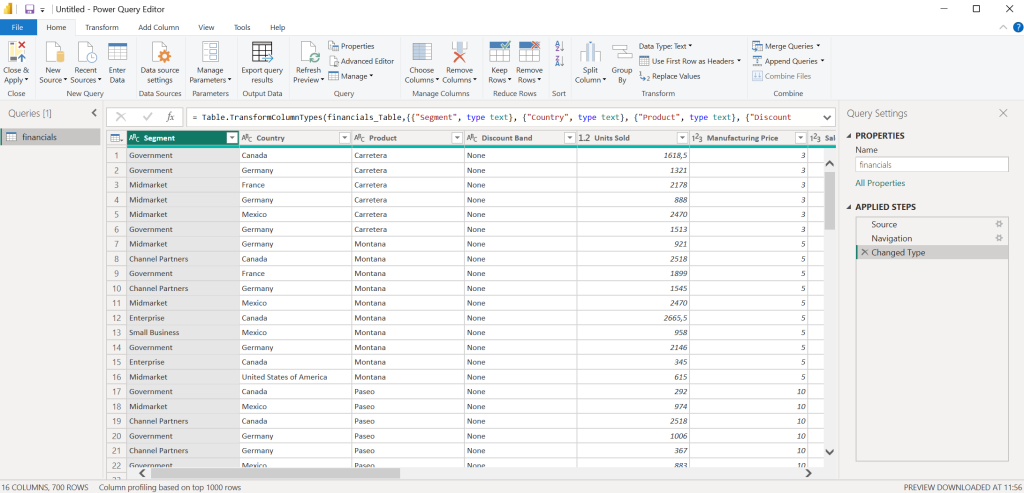
Power BI Desktop has two main areas for data modelling – The Power Query Editor and the Model View.
Power Query Editor
To apply transformations to the tables, you can use Power Query Editor through the Transform Data button. Here you can apply common data transformations such as adding, deleting, and editing columns, data types, and more. Changing column names is best done through the Power Query Editor and not the Model View. Transforming the data through Model View makes it hard to keep track of all the applied changes. It may lead to unnecessary steps that affect load times.
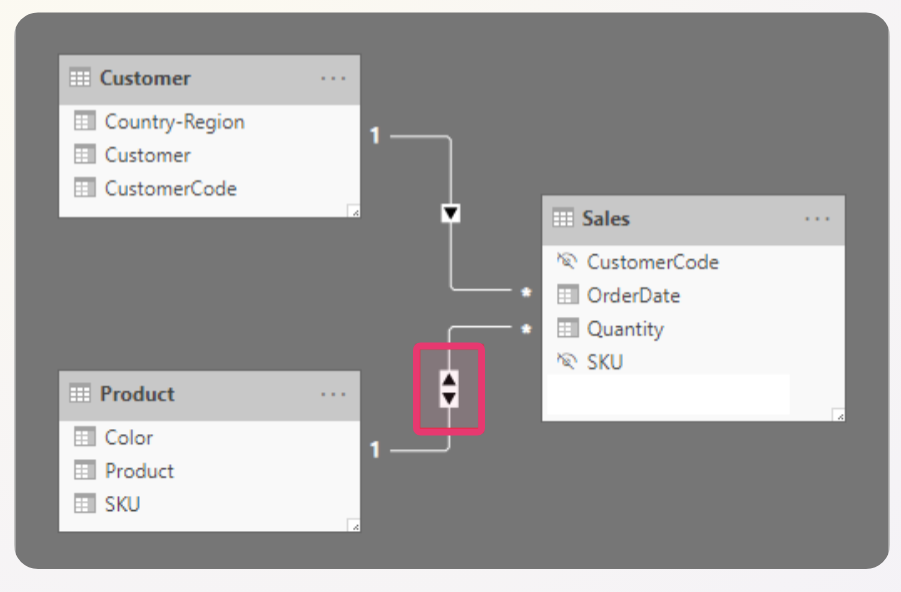
Model View
Semantic models are created through Model View. This area allows you to create a diagram of a subset of your data. This is where you create your star schema, drag tables into your model, and create relationships. When creating relationships, it is important to consider your entire Power BI ecosystem. For certain RLS scenarios, we have found that bi-directional relationships need to be defined between dimensions and the fact table. This is the case when you want to enable values of one dimension to filter the entire model.
Report Development
IBM Cognos
Reports are created, edited, and stored in web-based Cognos Analytics. Each visualization has an explicit query in the background, making reporting query-driven. Authors can apply filters to queries, add default parameters to prompts, and employ macros for dynamic logic. Furthermore, it is possible to apply simple set operations such as unions, joins, and excepts to queries. Objects within a query can be modified and enhanced with functions and calculations to present data exactly as you need. For delivering multidimensional reporting experiences – such as drill-up/dill-down analysis, hierarchies and aggregated measures, Cognos Analytics supports report development on dimensional sources, combining the flexibility of query-based reporting with the advantages of dimensional modeling.
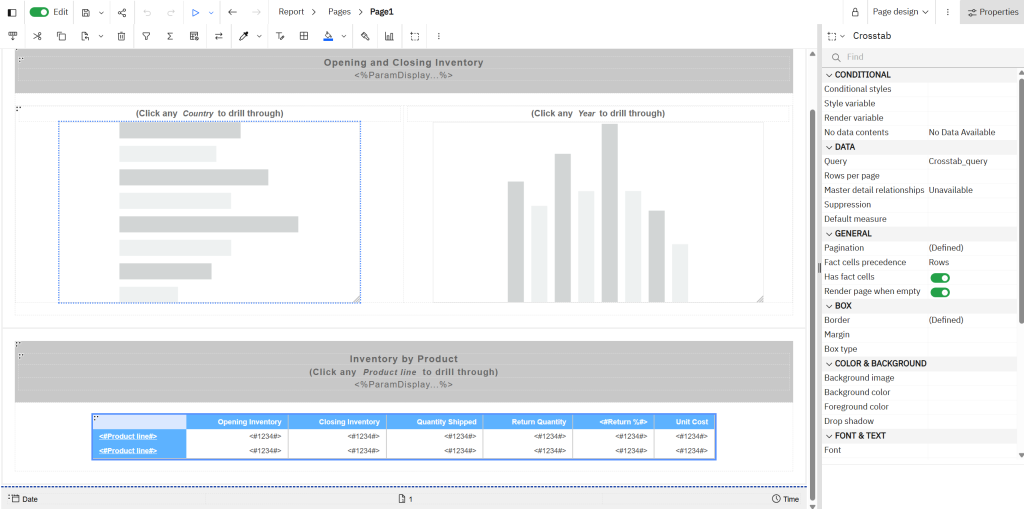
One big advantage of Cognos Analytics is the ability to create complex (pixel-perfect), multi-page reports. The layout engine is rich and supports custom HTML and JavaScript integration, sparklines, nested blocks, and conditional variables. Authors can define the exact layout and format requested by a client. This functionality is especially important when dealing with large enterprises, such as banks and financial institutions, as their reports require a rigid structure and precise formatting. Moreover, drill-through functionality allows parameterized navigation between reports. Linked reports can be hidden in the workspace(folder) if necessary.
For developers looking for an interactive, drag and drop approach – dashboards are the way to go. Cognos dashboards provide a simpler UI for creating modern visuals by dragging “widgets” onto a page.
Cognos also provides advanced scheduling and bursting features. Report authors can define timing, frequency, and output format (such as PDF, Excel, or HTML). Bursting enables automated generation and distribution of individualized report outputs via email or portal folders. While this supports large-scale distribution, very large bursts may impact server performance.
MS PowerBI
Report development in Power BI Desktop follows an interactive, drag-and-drop approach. The reporting experience is optimized for self-service, and advanced calculations can be defined using DAX – formula expression language used in several PBI products. Filtering is supported via slicers. However, slicer capabilities such as default values, cascading prompts, or parameter-like behavior are limited and highly dependent on model design. Power BI does not natively support features like macros or default parameter values.
One advantage of Power BI is the large library of built-in visualizations and downloadable custom content. Unfortunately, third-party visuals may require licensing, and availability can change over time. Certain visuals have fixed properties; for example, cards have default text alignment that cannot be altered, and matrix or list visuals offer limited formatting options. Flexibility of custom visuals depends on the developer of the visual.
Drill-through navigation is supported, allowing users to navigate between report tabs. Unlike Cognos, Power BI does not provide native enterprise report bursting or scheduled distribution, but users can subscribe to receive snapshots of reports. Complex paginated reports are not natively supported and require Power BI Report Builder, a separate reporting tool. Reports created in Power BI Desktop are published to the Power BI Service for sharing and collaboration.
Security
IBM Cognos
Security in IBM Cognos is implemented through both Cognos Framework Manager and Cognos Analytics. Enabling developers to instill security through the semantic modelling layer as well as the reporting layer provides strong support for governance. Additionally, it ensures full control over authentication, authorization, and access to data.
Row level security
Row-level security is implemented on the data modelling level. Developers can create security filters and apply them to query subjects in the model. These filters determine which rows of data a specific user, group, or role is allowed to see when generating reports. The groups and roles are defined in the Cognos Analytics Administration console. When the model is published as a package and used as a source by reports in Cognos Analytics, the defined filters are automatically enforced, ensuring consistent data access across all reports and dashboards built on that model.
Column level security
Column-level security is also implemented at the data modelling level and controls access to specific data items (columns). Developers can restrict visibility of sensitive fields by applying permissions to query items in Framework Manager. As a result, certain users, groups, or roles may be prevented from seeing specific columns in reports, even if they have access to the overall dataset.
Object level security
Object-level security controls access to specific objects within the model, such as query subjects, folders, or individual report elements. Developers can grant or deny permissions to these objects in Framework Manager or Cognos Analytics, ensuring that only authorized users can view or interact with them. This type of security is typically used to restrict access to entire sections of a model or reporting content, complementing row-level security by controlling access at a higher structural level.
Groups and roles
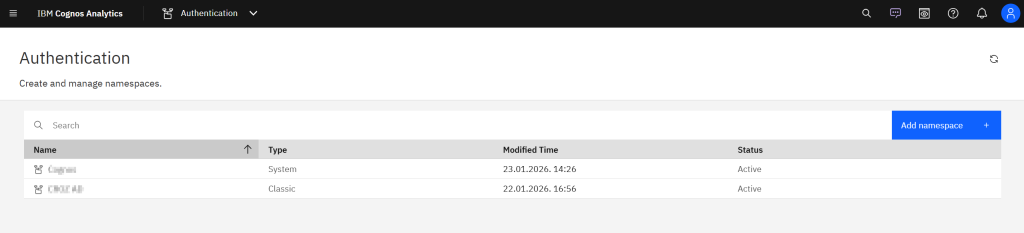
In Cognos Administration, groups and roles define which users can access specific folders, reports, and packages within the Cognos content store. Groups can originate from external sources (ex. LDAP or AD), but Cognos allows for groups and roles to be defined internally. Cognos groups in the Cognos namespace can be modified directly within Cognos Administration.
MS Power BI
Security in Power BI is implemented through Power BI Desktop and Power BI Service, while authentication is handled through Microsoft Entra ID. Security groups are defined and authenticated there. Once authenticated, authorization is managed through workspace roles and permissions applied to reports, dashboards, and semantic models. For every Power BI workspace, users can be assigned to roles such as Admin, Member, Contributor, or Viewer. Each role provides different levels of access to create, edit, or consume content.
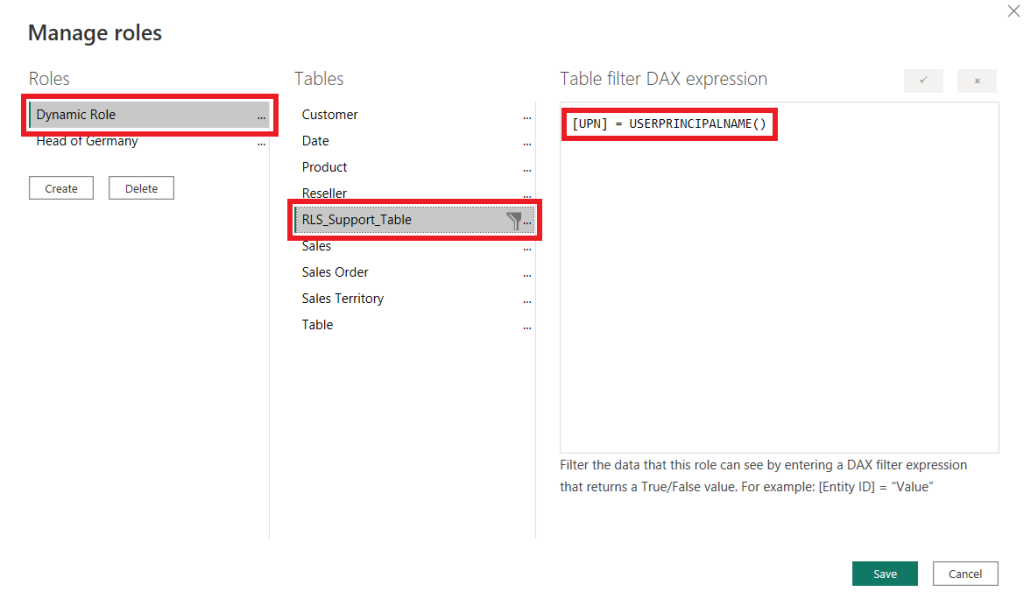
Power BI supports row-level security within the semantic model. RLS is typically defined in Power BI Desktop by creating roles and applying DAX that restricts which rows of data a user can access when viewing reports. However, some specific RLS implementations may require advanced DAX expressions. The design of security filters heavily depends on the semantic model design and source data. Object and column-level security is not natively supported but it can be implemented with the use of an external tool called Tabular editor 3.
After publishing the model to the Power BI Service, users or security groups are mapped to these roles to enforce the filters. This kind of approach allows organizations to centralize identity management while applying dynamic data access rules.
Conclusion
Making the choice between IBM Cognos Analytics and Microsoft Power BI depends on your organization’s specific requirements for data and reporting scenarios. While both platforms deliver strong capabilities for data visualization, semantic modeling, and security implementations, the approach is rather different. Cognos is heavily focused on enterprise-grade governance, strong security, separating modelling via Framework Manager, and complex reporting. On the other hand, Power BI excels in self-service business intelligence, modern, interactive reports, and SaaS architecture.
For organizations evaluating data visualization solutions, key considerations include reporting requirements, governance needs, and infrastructure preferences. Enterprises that prioritize complex reporting and strict governance may benefit from Cognos, while teams focused on rapid dashboard development and cloud analytics may prefer Power BI. Ultimately, selecting the right BI solution requires aligning platform capabilities with business goals, data architecture, and long-term business strategy.